

Authors #
Dr Glen Koorey, ViaStrada
Acknowledgements #
Dr Blair Turner, Road Safety Advisory Services Pty Ltd
Professor Narelle Haworth, Queensland University of Technology
Emeritus Professor Barry Watson, Queensland University of Technology
Reviewers #
Dr Judy Fleiter, The George Institute for Global Health
Dr Stephen Kome Fondzenyuy, World Bank Group
1. Overview of the involvement of excess speed in fatal and injury crashes #
A road network designed for “safe mobility” aims to provide an efficient system for moving people and goods to various destinations within the limits of a safe system that protects all road users and other people nearby. It also needs to take into account other considerations such as amenity, environment, travel behaviour change, and the wishes and views of the local community. One of the key inputs to help achieve many of these objectives are the regulatory speed limits on the network and associated speed management features.
The connection between speed and crashes is well documented, including Aarts & van Schagen (2006) and Doecke et al. (2021). Higher speeds have a significant impact on road trauma, and influence both the likelihood and severity of a crash. The number of crashes, especially serious ones, increase exponentially with speed. Even small increases in speed can result in a large increase in the road trauma experienced. The increased kinetic energy from high motor vehicle speeds in particular increase the risk of serious injuries among pedestrians and cyclists. The Global Road Safety Partnership (GRSP, 2023) Speed Management Manual notes that on residential roads, access roads and other places where there are many pedestrians, cyclists, and children, high speeds can also cause insecurity among residents and road users.
While there is often a perception that safer (i.e. lower) speed limits are not as “economic” or “productive”, due to longer travel times, the reality is that speed management brings broader benefits besides road safety, including reduced vehicle operating costs, reduced emissions and noise, increased active mobility rates, and increased commercial activity. Yannis & Michelaraki (2024) found several of these benefits in their review of several European cities that had introduced 30 km/h speed limits. In a study for NZ Transport Agency, Cameron (2012) found that the optimal speed limit economically for rural highways was typically no higher than 80 km/h.
International research by Fondzenyuy et al. (2024) backs up the above findings and showed that globally, speed was a contributing factor on average in ~54% of road fatalities. It was also noted that the proportion of fatalities and serious injuries attributable to speed is also generally higher in low/middle-income countries (LMICs) (57%), compared to 28% in high-income countries (HICs). This is due to the greater prevalence there of vulnerable road users such as pedestrians, cyclists and motorcyclists.
In recent years in Australasia, typically only about one third of fatal crashes and one quarter of serious injuries are formally attributed to “speed” or “speeding” as a contributing factor. However, Job & Brodie (2022) undertook a targeted assessment of road and crash data to better determine the roles of speed and speeding in serious crashes, and estimated that speeding is involved in ~60% of fatal crashes in New Zealand and that travel speeds above NZ’s “Safe and Appropriate Speeds” featured in ~70% of injury crashes.
Irrespective of what causes a crash, the outcome of any crash will always be determined by the forces applied at impact, which are directly related to travel speed.
2. Crash likelihood, injury severity, and speed #
Nilsson’s (2004) power model is often used to determine the estimated change in deaths or serious injuries (DSIs) based on the observed mean speeds before and after a change in speed limit or other speed management measure:

More recent research by Elvik et al. (2019) and used by the World Bank’s Global Road Safety Facility (GRSF, 2026) Speed Impact Tool suggests that the relationship between crash risk and speed is exponential at certain speeds rather than a power law:

Both models have their respective differences, depending on the relative speed changes involved. Table 1 gives the various alternatives of the exponent for Nilsson’s power model and Elvik’s exponential model.
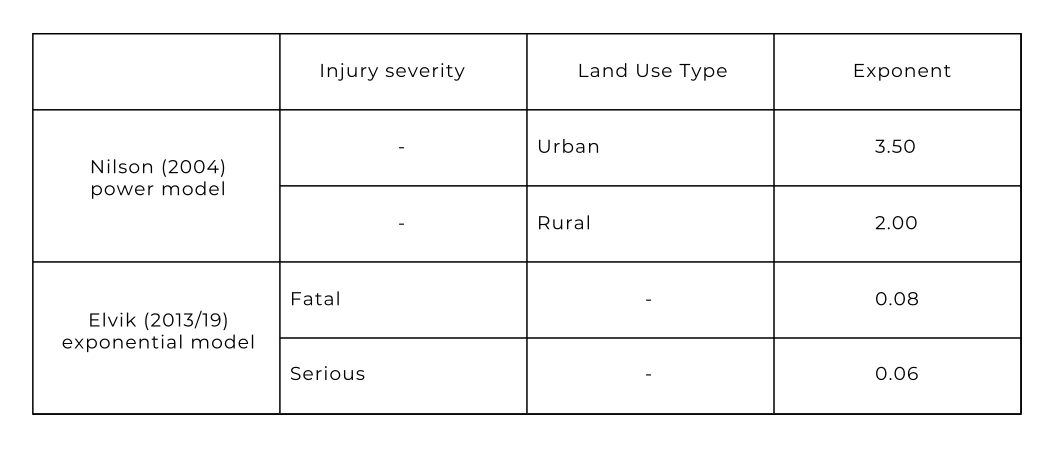
Table 1: Exponents for Nilsson’s power model and Elvik’s exponential model
Source: Adapted from Nilsson (2004) and Elvik et al. (2019)
Although it can vary by model type and speed limits, as a rough rule of thumb, a 1 km/h reduction in observed speeds typically leads to about a 4% reduction in fatalities, a 3% reduction in serious injuries, and a 2% reduction in other injuries.
The risk of injury (or death) in a crash is based on human tolerances to forces and is significantly affected by the relative speed of a vehicle in relation to other road users or a stationary object. There are well established relationships between impact speed and risk of death or serious injury for different crash scenarios; these are often in the form of an S-curve relationship (see Figure 1), increasing in risk as impact speeds increase.
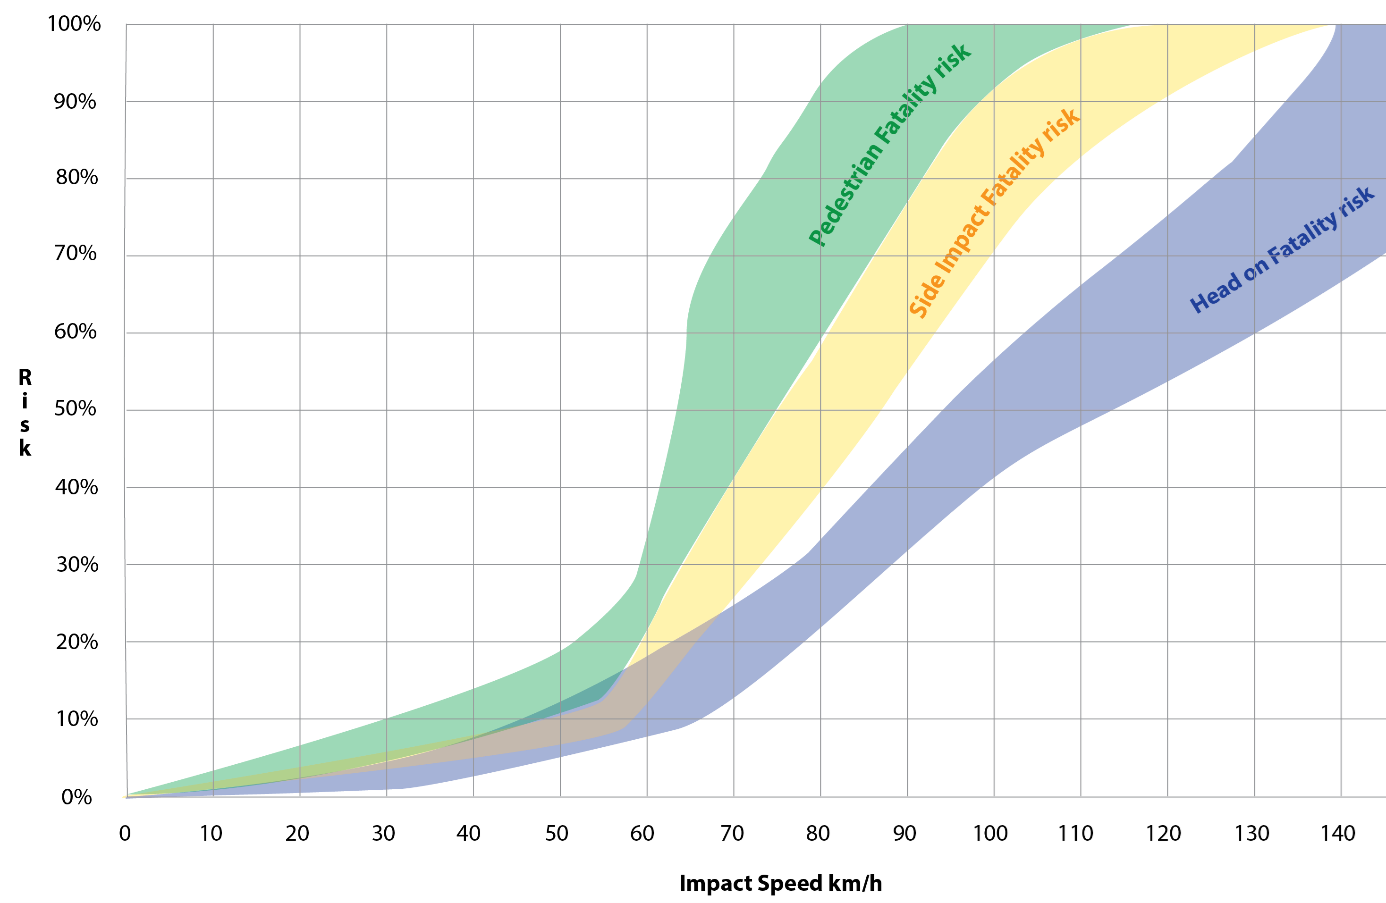
Figure 1: Fatal injury risk and impact speed
Source: Adapted from Scott & Mackie (2014)
3. Overview of behaviours that contribute to crash involvement at speed #
Higher speeds can be caused by certain behaviours or lead to certain outcomes:
- Limited reaction time to respond to changes in road user behaviour ahead.
- Loss of control due to vehicle speed (on both corners and straights).
- Drivers under the influence of alcohol or drugs may have misperceptions about their travelling pace, leading to faster speeds.
- Drivers more prone to excess speeding also tend to be more risk-takers in general, leading to unsafe traffic conflict situations.
- Driver speed choice can also be affected by societal norms (e.g. minimisation of speeding danger), situational demands (e.g. late for an activity), or social influences (e.g. peer pressure to go faster).
4. Measures to address speed management #
The following sub-sections describe some of the typical measures and interventions that can be applied to manage speeds. While they cover a range of different approaches, ideally a good speed management strategy should be multi-disciplinary in nature and involve the complementary use of several different interventions. The World Bank Guide for Safe Speeds (Turner et al., 2024) provides a thorough overview of many of these measures.
It should be acknowledged that there may be some limitations to the robustness of the evidence presented, and not all findings may be directly transferable between different countries (e.g. high-income to low/middle-income).
4.1. Crash prevention measures targeting speed #
There are several physical infrastructure treatments that can be introduced to reduce the likelihood of speed-related harm, often based around vertical and horizontal deflection or roadway narrowing. These include:
4.1.1. Safe System Intersection treatments (raised platforms/humps, roundabouts) #
- The New Zealand Transport Agency (NZTA, 2025) Crash Estimation Compendium noted that raised platforms reduce pedestrian crashes by 20%.
- The Institute of Transport Economics (TOI, 2025) Traffic Safety Handbook noted that installing speed bumps/humps result in up to 30% reductions in DSIs and >20% reductions in other injury crashes. Similar reductions have also been found for raised intersections. Turner et al. (2020) noted even greater reductions, particularly for fatal/serious pedestrian casualties.
- TOI (2025) noted that converting conventional intersections to roundabouts result in up to 70% reductions in fatalities and 45% reductions in injury crashes. Typically, smaller roundabouts have a more positive effect than larger ones.
4.1.2. Road speed management and other traffic calming #
- Elvik (2022-a) noted that the conversion of local streets to “environmental streets” or shared spaces (usually by means of surface changes, roadway narrowing, street furniture, and lower speed limits) can lead to more than a 30% reduction in injury crashes. Mean traffic speeds also typically fell by 5‑10 km/h, and potentially more with lower speed limits (see section on Behavioural interventions).
4.2. Injury severity reduction/mitigation measures #
As noted earlier, the impact speed of a collision can greatly affect the relative risk of injury or death. However, some measures, both inside and outside of vehicles, can affect the likely severity as a result of a collision. These include:
4.2.1. Vehicle safety features (crumple zones, airbags, side curtains) #
- Typically, these reduce injuries or serious trauma to various parts of the body.
- Høye (2015) noted that frontal airbags can reduce the risk of being killed by up to 28%, particularly for people wearing seatbelts. Side or curtain airbags were also similarly effective, particularly for side collisions.
4.2.2. Vehicle speed limiters and Intelligent Speed Adaptation (ISA) #
- Elvik (2022-b) noted that heavy vehicles with speed governors or mandated speed limits had a ~20% lower crash risk than heavy vehicles without them, although there was some uncertainty in the effect estimates.
- Elvik & Høye (2023-b) noted that the number of DSIs in crashes involving passenger cars could be reduced by 13% if all cars had warning ISA (i.e. a system that warns the driver when they are driving above the speed limit) and by 18% if all cars had mandatory ISA (that makes it impossible to drive above the speed limit).
4.2.3. Roadside and central median safety barriers #
- Typically, these help to absorb the kinetic energy involved in a high-speed collision.
- NZTA (2025) noted that continuous roadside and median wire rope barriers can reduce injury crashes by 65% and DSIs by 80%.
4.3. Exposure control measures targeting speed #
There are often relatively limited opportunities for traffic volumes to influence speed-related trauma, although it should be noted that some traffic may be encouraged to shift to higher-speed roadways, affecting the relative traffic exposure. Some potential opportunities are:
- Prohibition/removal of some high-risk turn movements at high-speed intersections.
- Introducing traffic calming and other local area traffic management in residential streets can reduce traffic volumes there, diverting traffic to safer arterial streets.
- Physical segregation of roadways from pedestrian and cycle facilities can also reduce the exposure of these active modes to the risk of adjacent motor vehicles.
- Traffic congestion can provide a useful speed management effect, resulting in more minor crashes (e.g. rear-end) rather than more serious ones. Interestingly, lower speeds often result in less congestion and improved traffic flow.
4.4. Behavioural interventions targeting speed #
Drivers can be influenced in their speed choice by traffic control devices, enforcement measures, and promotional campaigns. These include:
4.4.1. Reduced posted speed limits #
- A meta-analysis of over 200 speed limit change studies worldwide (Elvik et al., 2004) found the average observed speed change to be 2-3 km/h for every 10 km/h of posted speed limit change.
- Several NZ case studies of urban and rural speed limit reductions (Koorey, 2025) observed typical DSI reductions of at least 15-25% in urban areas and 20-30% in rural areas, but often much higher reductions.
- Yannis & Michelaraki (2024) observed reductions in injury crashes of at least 20-30% in several European towns that introduced 30 km/h urban speed limits.
4.4.2. Temporarily reduced intersection speed limits #
- Rural intersection activated warning signs display a lower dynamic speed limit on a rural main road when traffic is detected approaching on a side road.
- In reviewing ten sites trialled across New Zealand, Mackie et al. (2017) found a more than 50% net reduction all crashes after their installation and more than 75% reduction in DSI crashes.
4.4.3. Road markings #
- Several line-marking treatments can influence driver speed (by creating a perception of a narrower traffic lane); these include wide edgelines and centrelines, transverse bars, and herringbone pattern edging.
- Martindale & Urlich (2010) found that the introduction of transverse bars on either side of a traffic lane reduced mean observed speeds by at least 2-3 km/h.
4.4.4. Speed enforcement (cameras) #
- NZTA (2025) noted that mobile overt (visible) speed cameras can result in a 40% reduction in crashes, while mobile covert (hidden) and fixed overt cameras in rural areas have 20% and 30% reduction effects respectively. Elvik & Høye (2023-a) also noted similar reductions for point-to-point (P2P) speed cameras as well.
- Austroads research by D’Elia et al. (2025) found that both fixed P2P and mobile P2P systems could deliver substantial safety benefits. Observed speeds also tended to drop by more than 10% in the vicinity of fixed cameras before returning to nearly normal over 2km away. Wilson et al. (2010) also observed similar “distance halo” effects and “time halo” periods of at least 2-3 days after enforcement ceased.
- Cameron & Newstead (2021) recommended that a mix of the speed camera enforcement approaches described above may provide the best outcome.
4.4.5. Speed feedback signs #
- Høye (2022) noted that installing speed feedback signs (that display “YOUR SPEED #kmh” and maybe “SLOW DOWN” messages) can probably reduce the number of crashes, but this has only been investigated empirically to a limited extent. Reduced speed and speed variation have been mostly observed on straight sections, at transitions to lower speed limits, in curves, and at schools. However, the effect usually decreases over time.
- In Australia, these are also known as “Speed Awareness Monitors” (SAMs). Brisbane City Council installed several SAMs on local streets and noted an average 8.1 km/h reduction by those alerted to exceeding the speed limit (Brisbane City Council, 2018).
4.4.6. Speed reduction campaigns #
- Promotional campaigns highlighting the dangers of speeding and encouraging reduced speeds can be disseminated via various media formats (e.g. TV, radio, print, social media) or roadside messaging. The relative effectiveness is mixed though.
- Public awareness campaigns are most effective when coupled with enforcement. One of the aims of such campaigns is to increase the perceived risk of apprehension; the SafetyNet (2009) noted the perception that the public may be caught at any time provides a “general deterrence” effect, impacting road users’ behaviour.
- In a study reviewing the impact of roadside variable-message signs on highways in France, Chaurand et al. (2015) found that messaging framed in terms of “gains” (e.g. fewer crashes, reduced fuel consumption) was more effective than those framed in terms of “loss” due to higher speeds.
- Conversely, Glendon & Prendergast (2019), in assessing respondent’s reactions to 18 different types of roadside messaging, found that “threat”-based messaging (i.e. the potential consequences of speeding) were considered more effective than “coping”-based messaging (i.e. the potential rewards of reducing speed).
- In a study targeting young male drivers with anti-speeding advertising, Lewis et al. (2017) found that positive persuasive effects, and a relative absence of any negative, dissuasive effects, were found for messages emphasising factors that discourage speeding or challenging factors that encourage speeding.
5. Reference List #
Aarts, L., & van Schagen, I. (2006). Driving speed and the risk of road crashes: A review. Accident Analysis & Prevention,38(2), 215-224. https://doi.org/https://doi.org/10.1016/j.aap.2005.07.004
Brisbane City Council. (2018). SLOW for SAM (Speed Awareness Monitors). Radar Speed Displays Ltd. https://radarspeeddisplays.com.au/slow-for-sam/
Cameron, M. (2012). Economic analysis of optimum speeds on rural state highways in New Zealand. Waka Kotahi NZ Transport Agency (published 2022). https://www.nzta.govt.nz/resources/economic-analysis-of-optimum-speeds-on-rural-state-highways-in-nz/
Cameron, M., & Newstead, S. (2021). Increasing the effectiveness of mobile speed cameras on rural roads in Victoria based on crash reductions from operations in Queensland. Journal of Road Safety,32(2), 16-21. https://doi.org/10.33492/JRS-D-20-00273
Chaurand, N., Bossart, F., & Delhomme, P. (2015). A naturalistic study of the impact of message framing on highway speeding. Transportation Research Part F: Traffic Psychology and Behaviour,35, 37-44. https://doi.org/https://doi.org/10.1016/j.trf.2015.09.001
D’Elia, A., Batson, A., Newstead, S., Rampollard, C., & Cameron, M. (2025). Mobile point-to-point speed enforcement best practice review: Literature review and international consultation (AP-R733-25). https://austroads.gov.au/publications/road-safety/ap-r733-25
Doecke, S. D., Dutschke, J. K., Baldock, M. R. J., & Kloeden, C. N. (2021). Travel speed and the risk of serious injury in vehicle crashes. Accident Analysis & Prevention,161, 106359. https://doi.org/https://doi.org/10.1016/j.aap.2021.106359
Elvik, R. (2022-a). Environmental streets. Traffic Safety Handbook. Institute of Transport Economics. https://www.tshandbok.no/del-2/3-trafikkregulering/doc651/
Elvik, R. (2022-b). Top speed limiter. Traffic Safety Handbook. Institute of Transport Economics. https://www.tshandbok.no/del-2/4-kjoeretoeyteknikk-og-personlig-verneutstyr/4-33-toppfartssperre/
Elvik, R., Christensen, P., & Amundsen, A. H. (2004). Speed and road accidents: An evaluation of the Power Model (740/2004). Institute of Transport Economics. https://www.toi.no/publications/speed-and-road-accidents-an-evaluation-of-the-power-model-article17882-29.html
Elvik, R., & Høye, A. (2023-a). Automatic Traffic Control (ATC). Traffic Safety Handbook. Institute of Transport Economics. https://www.tshandbok.no/del-2/8-kontroll-og-sanksjoner/doc735/
Elvik, R., & Høye, A. (2023-b). Intelligent speed adaptation and geofence speed limiter. Traffic Safety Handbook. Institute of Transport Economics. https://www.tshandbok.no/del-2/4-kjoeretoeyteknikk-og-personlig-verneutstyr/4-34-automatisk-fartstilpasning/
Elvik, R., Vadeby, A., Hels, T., & van Schagen, I. (2019). Updated estimates of the relationship between speed and road safety at the aggregate and individual levels. Accident Analysis & Prevention,123, 114-122. https://doi.org/https://doi.org/10.1016/j.aap.2018.11.014
Fondzenyuy, S. K., Turner, B. M., Burlacu, A. F., & Jurewicz, C. (2024). The contribution of excessive or inappropriate speeds to road traffic crashes and fatalities: A review of literature. Transportation Engineering,17, 100259. https://doi.org/https://doi.org/10.1016/j.treng.2024.100259
Glendon, A. I., & Prendergast, S. (2019). Rank-ordering anti-speeding messages. Accident Analysis & Prevention,132, 105254. https://doi.org/https://doi.org/10.1016/j.aap.2019.07.030
Global Road Safety Facility. (2026). Speed Impact Tool. https://www.globalroadsafetyfacility.org/speed-management-hub
Global Road Safety Partnership. (2023). Speed management: a road safety manual for decision-makers and practitioners. https://www.grsproadsafety.org/resources/good-practice-manuals/
Høye, A. (2015). Airbags in light vehicles. Traffic safety handbook. Institute of Transport Economics. https://www.tshandbok.no/del-2/4-kjoeretoeyteknikk-og-personlig-verneutstyr/doc686/
Høye, A. (2022). Variable traffic signs. Traffic safety handbook. Institute of Transport Economics. https://www.tshandbok.no/del-2/3-trafikkregulering/doc669/
Institute of Transport Economics. (2025). Traffic safety handbook. https://www.tshandbok.no/
International Transport Forum. (2018). Speed and crash risk. International Traffic Safety Data and Analysis Group. International Transport Forum/Organisation for Economic Co-operation and Development. https://www.itf-oecd.org/speed-crash-risk
Job, S., & Brodie, C. (2022). Understanding the role of speeding and speed in serious crash trauma: A case study of New Zealand. Journal of Road Safety, 33(1), 5-25. https://doi.org/10.33492/JRS-D-21-00069
Koorey, G. (2025). Summary notes of various NZ before-after speed evaluations. https://docs.google.com/document/d/1H1nzcDDcFEs-jiwKzRfn0gUCupdqgnku/
Lewis, I., White, K. M., Ho, B., Elliott, B., & Watson, B. (2017). Insights into targeting young male drivers with anti-speeding advertising: An application of the Step approach to Message Design and Testing (SatMDT). Accident Analysis & Prevention,103, 129-142. https://doi.org/https://doi.org/10.1016/j.aap.2017.04.004
Mackie, H., Brodie, C., Scott, R., Hirsch, L., Tate, F., Russell, M., & & Holst, K. (2017). The signs they are a-changin’: Development and evaluation of New Zealand’s rural intersection active warning system. Journal of Road Safety,28(3), 11-21. https://journalofroadsafety.org/article/32176
Martindale, A., & Ulrich, C. (2010). Effectiveness of transverse road markings on reducing vehicle speeds (423). https://nzta.govt.nz/resources/research/reports/423
New Zealand Transport Agency. (2025). Crash estimation compendium: New Zealand crash risk factors guidelines (2nd ed., version 3). https://nzta.govt.nz/resources/crash-estimation-compendium
Nilsson, G. (2004). Traffic safety dimensions and the Power Model to describe the effect of speed on safety (Bulletin 221). Lund Institute of Technology. Sweden. https://portal.research.lu.se/en/publications/traffic-safety-dimensions-and-the-power-model-to-describe-the-eff
SafetyNet. (2009). Speed enforcement. European Commission. https://road-safety.transport.ec.europa.eu/eu-road-safety-policy/priorities/safe-road-use/safe-speed/archive/speed-enforcement_en
Scott, R., & Mackie, H. (2014). Speed/injury Risk Curves: Analysis of evidence and considerations for updated curves. https://www.bikeauckland.org.nz/wp-content/uploads/2018/09/Mackie-Research-Report_Speed-vs-injury-risk.pdf
Turner, B., Job, S., & Mitra, S. (2021). Guide for road safety interventions: Evidence of what works and what does not work. World Bank. http://hdl.handle.net/10986/35176
Turner, B. M., Eichinger-Vill, E. M., El-Samra, S., Adriazola-Steil, C., & & Burlacu, F. A. (2024). Guide for safe speeds: Managing traffic speeds to save lives and improve liveability. Global Road Safety Facility, World Bank. https://www.roadsafetyfacility.org/publications/guide-safe-speeds-managing-traffic-speeds-save-lives-and-improve-livability
Wilson, C., Willis, C., Hendrikz, J. K., Le Brocque, R., & Bellamy, N. (2010). Speed cameras for the prevention of road traffic injuries and deaths. Cochrane Database of Systematic Reviews (10). https://doi.org/10.1002/14651858.CD004607.pub3
Yannis, G., & Michelaraki, E. (2024). Review of city-wide 30 km/h speed limit benefits in Europe. Sustainability,16(11), 4382. https://doi.org/10.3390/su16114382