
Authors #
Dr Jamie MacKenzie, Centre for Automotive Safety Research (CASR), Adelaide University
Associate Professor Robbie Napper, Monash University
David Beck, Datum Road Safety
Dr Tana Tan, Safe System Solutions Pty Ltd
Mark Terrell, ANCAP
Reviewers #
Dr Stephen Kome Fondzenyuy, World Bank Group
Carla Hoorweg, ANCAP
Sam Doecke, Centre for Automotive Safety Research (CASR), Adelaide University
Johann Tay, Traffic Vehicles & Logistics Pty Ltd
Abstract #
This chapter aims to present the reader with a foundational understanding of the role vehicles play in road safety. While the concept of a vehicle may be fairly simple, when delving into the details we can see that the myriad variations and types of vehicles means that there is no neat definition for all types. The vehicle fleet varies, and the make-up of a fleet in any particular place is a result of prevailing culture, economics and regulation to name just three. While vehicles ease transport of people and goods, they also do so to varying extents and at widely varying costs to society and the user. Vehicles vary as do roads, and even road rules and licensing. People use vehicles for a wide array of purposes; wherever and for whatever purpose, the road safety practitioner will do well to bear this variation in mind.To improve safety, there is a range of designs and systems that can be employed to reduce the likelihood of injury in the inevitable occurrence of a collision. Some of these design features and safety systems are mandated through vehicle design standards, while others are encouraged through safety rating assessment programs. Beyond manufacture, it is important that vehicles are maintained properly to ensure all features and systems are operating optimally.
Abbreviations #
| ABS | Antilock Braking System |
| ACC | Adaptive Cruise Control |
| ADAS | Advanced Driver Assist Systems |
| ADR | Australian Design Rules |
| AEB | Autonomous Emergency Braking |
| ARAS | Advanced Rider Assist Systems |
| ASTM | American Society for Testing and Materials |
| BSD / BSM | Blind Spot Detection / Blind Spot Monitoring |
| C-ABS | Cornering-Antilock Braking System |
| C-ECBS | Cornering-Electronic Combined Brake System |
| EBA | Emergency Brake Assist |
| EDR | Event Data Recorder |
| ESC | Electronic Stability Control |
| FCW | Forward Collision Warning |
| GTR | Global Technical Regulation |
| HHA | Hill Hold Assist |
| HIC | Head Injury Criterion |
| HV | Heavy vehicle |
| IA | Impact Analysis |
| ISA | Intelligent Speed Assist |
| ISO | International Standards Organization |
| FSI | Fatal or Seriously Injured |
| LDW | Lane Departure Warning |
| LKA | Lane Keep Assist |
| LMIC | Low- and Middle-Income Country |
| LSS | Lane Support System |
| MSC | Motorcycle Stability Control |
| NCAP | New Car Assessment Program |
| PMD | Personal Mobility Device |
| PPE | Personal Protective Equipment |
| PT | Public Transport |
| PTW | Powered Two and Three Wheeler |
| RCW | Rear Collision Warning |
| RDA | Rear Distance Alert |
| UNECE | United Nations Economic Commission for Europe |
| VKT | Vehicle Kilometre Travelled |
| VRU | Vulnerable Road User |
1. Introduction #
1.1. What are vehicles? #
All transport systems are made up of vehicles, ports and ways. For the road transport system, we can say vehicles, origins and destinations, and roads including road related areas. These three elements must work in harmony to provide a working system, however this harmony is at times flawed or incomplete, as in the case of road safety where we know crashes and conflicts occur. We rely on vehicles to ease the movement of people and goods. Whether by the provision of wheels, or wheels and motors, the vehicle presents a range of considerations for the road safety practitioner. The scope of what we might call a vehicle is very broad, from devices such as scooters, bicycles and wheelchairs to trucks and buses. Although walking features no such device, for the purposes of road safety walking is an important – if vehicle-less – mode of transport that falls within the scope of this chapter.
In broad terms, the safety of vehicles can be understood statistically – powered two wheelers represent 25% of road fatalities globally, followed by four wheeled vehicles at 25%, and pedestrians at 21% (World Health Organization [WHO], 2023).
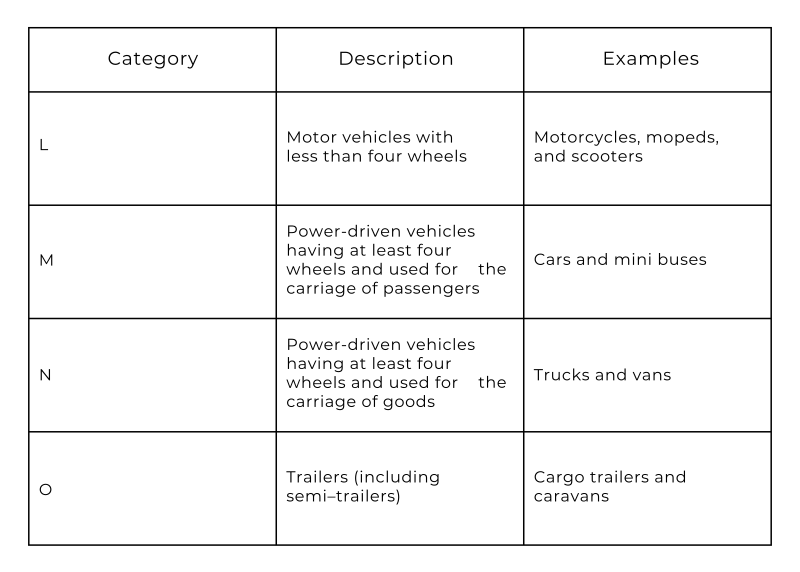
Different cultures will have localised classification systems for vehicles attuned to their own local needs and conditions. Motor vehicles such as cars and trucks tend to have a dominant presence in road safety discourse, especially in motor-normative cultures. However, they do not represent the sum total of all vehicles. The United Nations Economic Commission for Europe (UNECE) was established in 1947 with the aim of promoting economic cooperation and integration among its member states. In 1952, Working Party 29 (WP29) was established under the UNECE to facilitate the harmonisation of vehicle regulations among member countries, with the aim of improving vehicle safety and environmental standards globally. The UNECE Classification and Definition of Vehicles (UNECE, 2017) somewhat guides the structure of this chapter and provides a means to identify a variety of cars, trucks, buses, motorcycles and trailers, to which we add human powered vehicles such as bicycles, smaller rideable devices such as kick-scooters and e-scooters, as well as pedestrian and pedestrian-adjacent vehicles such as skateboards. Table 1 summarises the classification of motor vehicles by UNECE WP29 (UNECE, 2017), which will be discussed in this chapter in addition to smaller motorised, and non-motorised vehicles.
Source: Adapted from UNECE (2017)
1.2. Vehicles in relation to other parts of the road transport system #
Vehicles do not exist in isolation. Vehicles and other road users, including pedestrians and cyclists, depend on infrastructure to move around. Roads and road related areas such as footpaths are the context in which vehicles work, to deliver people and goods from an origin point to a destination. The destination may be an interchange with another transport system such as a railway station or airport.
While this chapter focuses on vehicles, it is important to place them in context within the greater road transport system to illustrate the considerations of road safety. Following on from above, the road transport system facilitates the movement of vehicles by means of ways (more commonly called infrastructure), ultimately to deliver people and goods to a port (for example, a destination such as a domestic home, a warehouse, or a transport interchange such as railway station). Furthermore, a crucial consideration is that vehicles are ultimately ‘piloted’ by people from different demographic groups, cultures, and levels of experience. Each of the contextual aspects described in this paragraph are explored in further detail below.
While not covered below, a more contemporary consideration is how the transfer of information, such as congestion or signal phases, facilitates better movement and safety. When information like this is transferred through the transport system, it becomes known as an intelligent transport system.
1.2.1. Infrastructure #
Vehicles rely somewhat on infrastructure. This is most apparent in urban places where paths and roads are clearly defined, and are ubiquitous parts of the town fabric. In contrast, even in remote areas, a graded dirt road has a role to play in road safety. Infrastructure provides many benefits to vehicles. For example, the provision of smooth, well drained roads will make motorcycling safer than riding on a rough track. Signs and painted lines provide behavioural guidance to road users and more recently can be read by the vehicles themselves. Infrastructure also dictates speed to a large extent, and speed is a major consideration in road safety. Roads in particular provide the means for safe and legal operation of vehicles, and guide drivers in matters such as lateral road placement, queueing, and giving way. In many places these messages to road users are confusing or poorly defined, such as the use of “Sharrows” which can be interpreted in different ways and are not in harmony with the road rules (VicRoads, 2016). A pedestrian crossing is a good example of how specific behaviours are suggested, sometimes required, in relation to infrastructure. While the design of vehicles and ports is regulated, infrastructure has the strongest connection to regulation and law. In many cases, such as stopping at a red light, the infrastructure is directly linked to required behaviour from road users.
1.2.2. Interchanges, parking and ports #
Trips in vehicles are made from and to various origins and destinations. When considering the range of vehicles falling into the scope of this chapter, an equally large array of destinations come to mind. Road safety practitioners are advised to consider the differences between a home driveway, a bus interchange at a railway station, a coach terminal, freight terminal, and downtown bikeshare dock. These interchanges are places for people to enter and exit vehicles themselves (for example, transitioning from vehicle driver to pedestrian) and, as such, often contain a mixture of road users and vehicles. The characteristics of vehicles are brought into sharp relief when considering the goings-on at interchanges. For example, truck driver blind-spots are of interest at freight terminals, and around tight city intersections.
1.2.3. Pilots of vehicles #
Beyond the many types of vehicles, there will naturally be differences in the way specific types of vehicles are operated due to the people in control. Some vehicle pilots may act more aggressively while others may act in a defensive manner. Some may adhere strictly to their understanding of road rules, or cultural etiquette, while others may act more assertively in situations and circumstances where aspects such as right-of-way are unclear.
These differences are often, though not always, correlated with demographics and experience. For example, young drivers, particularly males, are often found to accelerate more aggressively and be more inclined to take risks (Constantinou et al., 2011). Conversely, vulnerable road users such as pedestrians and cyclists are more likely to navigate the road system with caution in recognition of their relative vulnerability in the event of a collision with a vehicle. This is especially pertinent for extremely vulnerable pedestrians such as the elderly, who may be physically frail and take longer to traverse the roadway, and children, who lack an understanding of risk around the road, and those with disabilities.
Another consideration is the requirement, or lack thereof, of a license to pilot specific types of vehicle. There is virtually no restriction as to who can ride a bicycle on the roadway and, thus, all levels of skill could be encountered. Conversely, obtaining a heavy vehicle license typically requires some degree of training and accreditation, which should ensure a minimum level of competency for those who are operating such vehicles.
However, this highlights an important final point. All human behaviour is fallible, regardless of pilot skill or experience. Further, behaviour will be degraded in certain situations such as when a pilot is fatigued, stressed, or under the influence of drugs and alcohol.
1.3. Vehicles as a road safety tool #
Vehicles represent a unique tool for addressing road safety, compared with other aspects of the road transport system.
With infrastructure, it is typically governments who are entirely responsible for funding, design, delivery and maintenance. Significant infrastructure can take a long time to develop as well as a lot of resources/funding. Additionally, reviewing and updating design standards in response to new knowledge is often slow, and even slower is the process to then apply such updates to existing infrastructure.
At the opposite end of the spectrum, individual people are responsible for their own behaviour as road users. People can change their behaviour at a whim but, depending on culture, may be difficult to manage or influence into behaving the way road safety professionals and policy makers would like.
Between these two extremes are vehicles. While governments have a limited influence on the specifics of vehicle design, for commercial and economic reasons, the inclusion of specific safety features or capabilities can be regulated (e.g. mandatory ESC, AEB). Compared to infrastructure, vehicles typically have shorter lifespans, so can be more rapidly updated as new safety innovations are implemented. Further, improvements to vehicle safety systems will be effective wherever a vehicle is driven, while infrastructure will only improve safety in the specific locations where it is installed.
2. Modes of transport #
As noted above, there are an array of different ‘types’ of vehicle that can be considered as modes of transport and each have various characteristics when it comes to road safety.
2.1. Walking #
While not strictly a vehicle, walking is a fundamental transport mode. Usually slower than most other modes, it is cheap, silent and accessible. For the majority of humans, it represents the primary means of mobility, especially as a short-distance transport mode in its own right, or a mode used to access others, such as walking to a bus stop. In central city areas we might think that cars or bicycles dominate, but it is usually walking which is the most abundant mode of transport. Walking is a ubiquitous mode of transport and an important topic in road safety. It encompasses people using walking frames, wheelchairs and other assistive devices such as mobility scooters. Depending on jurisdiction it may include small devices such as skateboards and children on bicycles, which are often legally considered pedestrians.
People rarely suffer life-threatening injuries from the hazards of walking, however this changes when people walk in environments shared with fast moving, comparatively heavy vehicles such as cars. A further hazard comes from cars being parked on the roadside, adjacent to footpaths. When a pedestrian wishes to cross the road they have to walk in a gap between vehicles and this makes them less visible. The introduction of motor vehicles has led pedestrians to be classified as “vulnerable road users” by most road safety policies globally. Compared to a motor vehicle occupant, a pedestrian has no protection from rapid changes in kinetic energy, and is less visible because of their smaller size. Exposure to hazards is the key issue for walking in the road transport system – and reductions in vehicle speed limits can significantly address these hazards (WHO, 2025a). Research from Victoria Walks suggests that the vulnerability of young (children) and elderly cohorts of pedestrians is higher than those in the middle-aged cohorts (Garrard, 2017; Garrard, 2023).
It is difficult to provide a general definition of places where walking is likely to occur. While we can see people completing journeys by foot using paths and the sides of roads, as an access mode walking permeates the road transport system to a great extent. Using walking to access other modes results in pedestrian activity in amongst other modes, so car parks become interchanges of car traffic and pedestrian traffic, with the latter being more vulnerable to injury. Tram, bus and light rail stops are of particular interest, since passengers embarking and disembarking from these mass transport modes can be both numerous and, depending on infrastructure design, may be entering into a road space that carries vehicles. To provide an example, Melbourne, Australia alone has hundreds of tram stops in the centre of roads which, when a tram arrives, are transformed into miniature, temporary pedestrian centres. For these to function safely, vehicle drivers are responsible for stopping, and to some extent we use the design of suitable infrastructure at these places to help ensure safety. Consider the movement of a bus load of high school students who have a short walk across a carpark from a bus stop to school. While we consider their mode of transport to school to be “bus”, they are using walking as the egress mode. While some modes of transport are confined to certain ways, walking is relatively unconstrained. It is possible to walk nearly everywhere in the built environment. The path of a pedestrian often follows a line of desire, rather than a line of infrastructure such as a pedestrian crossing.
Walking is beneficial to physical and mental health because of the benefits of exercise, increasing the accumulation of physical activity recommended by the World Health Organization (2025). Furthermore, as a transport mode walking is unusual in that it bestows many social benefits – rather than social costs. Governments tend to encourage walking in order to realise social, economic and environmental benefits, and this becomes a factor in road safety when we consider what burden to place on pedestrians for safety (WHO, 2025a). The benefits of walking will not be realised if superseded by pedestrian crash trauma. Depending on the setting and even local culture and customs, let alone laws, it is worth considering how attentive pedestrians need to be with regard to hazards. So called “shared zones” have been created whereby the legal responsibility for safety is carried by those operating the motorised and vehicular modes of transport, leaving the pedestrians free to realise the social benefits of walking by perhaps engaging in conversation.
2.2. Bicycles and other cycles #
The bicycle as we know it today was a bringing together of pre-existing technologies such as pedals, chain transmissions, and the notion of a vehicle with two wheels in line. The bicycle as we know it today, the “rear drive safety cycle” was so called because it was safer than the large front wheeled “ordinary” cycle which preceded it. This vehicle has continued to develop technologically, while still being recognisable as based on the original (Herlihy, 2004). Cycling of any kind – electrically assisted or not – requires human power and because the machines are relatively simple, this form of transport is cheap, healthy, emission free, and faster than walking (WHO, 2025a). For these reasons and many others, most governments at all levels around the world support and encourage the growth of cycling mode share, however, these same government invest in safety at very different rates (WHO, 2025a). The forerunners to bicycles were conceived as a replacement for the horse, and once the bicycle was a mature invention, they rose to popularity in a time before cars (Reid, 2015; Herlihy, 2004). Road improvement programs were advocated for by cyclists and cycling organisations to ease their mechanical movement, and as with the introduction of any new mode into crowded cities, the rise in popularity of bicycles was, and remains, a contested topic.
From a road safety perspective, bicycles and other cycles such as trikes are of interest and come into sharp focus when we consider the dimensions of roads, lanes and paths built for them, or where road rules determine where they are ridden and by whom. It is possible for many people to learn to ride a bicycle, and the learning can happen at any able-bodied age. In many cultures a bicycle is the first vehicle a child can operate with autonomy from a carer.
The mode share of cycling varies place-by-place, which means how many bicycles road safety practitioners encounter in their work depends on many local factors. It also varies over time, with many high-income countries seeing a peak in cycling around the 1930s and then a decline in the 1940s with the implementation of car-centric city planning (Oldenziel et al., 2016). This time-based division also shows how some places have aimed to keep or restore cycling mode share by building separated infrastructure whereas others have planned for bicycles, cars and trucks to share the same street space. There is much debate and nuance concerning how this is done best. Contemporary approaches to sharing roads are based on the WHOs advice not to share if the speed limit is greater than 30km/h (WHO, 2025b). Many jurisdictions enforce minimum passing distances for motor vehicles driving past bicycle riders.
Bicycles and similar cycles tend to be smaller than many other vehicles on roads, leading to visibility concerns. These are exacerbated in low visibility conditions such as fog, and in hours of twilight and darkness. Many jurisdictions have rules about vehicle lighting which include bicycles. A contemporary trend is for vehicles of all types to use daytime running lights, and bicycles are no exception to this. However, there is also evidence that this is not just a visibility issue, but that drivers often ‘look but fail to see cyclists’ even when they are quite obvious (Herslund & Jørgensen, 2003). Cyclists are extremely susceptible to this phenomenon as they are small, not a safety threat to drivers, and are typically ranked low on a driver’s “attentional hierarchy” (Rumar, 1990). In some locations cyclists can be rare compared with vehicular traffic, so drivers don’t expect cyclists to be around and thus do not actively look for them.
Similar to pedestrians and other micromobility users, bicycle riders have no protection equivalent to that provided by a car body. As such they are categorised as vulnerable road users. Many places strive to provide protection to bicycle riders by means of the law, and infrastructure that separates them from motor vehicles. For safety, engineering controls such as separation are preferred forms of implementation compared to Personal Protective Equipment (PPE).
Despite this, some places provide little engineering protection and instead legislate the wearing of helmets. Helmets have been demonstrated to reduce head related trauma from impact, but also to reduce the uptake of cycling (Høye, 2018). Depending on the context, helmet laws can have problematic outcomes for population health, with the Netherlands, for example, showing that the benefits of cycling for the whole population outweigh the negative effects of head related trauma for the few people involved in crashes, since safety is designed into the infrastructure as engineering protection – higher up the safety hierarchy than personal protective equipment (PPE) (Fietserbond, 2026). Government policy grapples with this tension and different outcomes can be observed across jurisdictions globally.
Depending on the jurisdiction, most bicycle vehicles must comply with the safety standards set out in ISO4210 when they are sold new. For example, in Australia through standards (Australian Competition and Consumer Commission, 2026). This standard requires a basic level of functionality including braking systems, retroreflectors, no sharp edges or hazards on the vehicle itself.
Bicycles are used by a large cross section of the world’s population. Unlike many other vehicles, they can be operated by children and do not require a licence. Bicycles are used for many purposes, and the bicycle derivatives such as e-bikes, (e)cargo bikes, recumbents and racing bikes lead to many and varied on-road characteristics such as longer, wider vehicles used for freight and passengers. When combined with public transport, users can travel from their front door to a high-speed mode such as train and then complete their journey using a shared bicycle. Delivery riders using bicycles are a common sight in many urban areas, and these riders use a variety of vehicles including e-bikes and novel, powered micromobility vehicles (see below).
2.3. Small devices and powered micromobility #
Micromobility devices—such as electric scooters, e-bikes, and other compact, often motorised forms of personal transport—have become increasingly popular in urban environments. Their proliferation has increased as batteries and electric motors have become cheaper, smaller and more powerful in recent decades. They offer a flexible, low-emission alternative to traditional vehicles, especially for short trips. However, their rapid adoption has introduced a range of road safety challenges that cities and policymakers are still grappling with. Vehicles such as these exist in a variety of shapes and sizes, and to some extent can overlap with the definition of bicycles, and powered two/three wheelers.
As with the introduction of many new modes of transport in history, one of the most pressing issues with the range of micromobility vehicles is the lack of suitable infrastructure. Technological change in vehicles tends to move faster than a corresponding change in infrastructure and as such it is only after the adoption of a vehicle that we see changes in infrastructure (Reid, 2015). Many contemporary urban areas were not designed with large volumes of vehicles or micromobility in mind. Some of these spaces are adapted over time to accommodate certain modes of transport, for example historical town centres being pedestrian friendly, or the dominant trend in car-centric planning seen since World War Two (Oldenziel et al. 2016). Newer, smaller vehicles often don’t feature the safety systems or speeds suitable for riding alongside vehicles on the road, and travel too fast and quietly to reasonably share space alongside pedestrians on the footpath. A lack of infrastructure frequently creates conflict and increases the risk of collisions. Incompatible infrastructure is also an issue, with kerbing that has been designed for compatibility with passenger vehicle wheels resulting in falls when encountered by small wheeled vehicles.
As for any vehicle, but perhaps exacerbated by the novelty of vehicles in this category, riders may be inexperienced, unfamiliar with traffic rules, or prone to risky actions such as riding without helmets, ignoring traffic signals, or using devices while intoxicated. These behaviours, combined with the relatively high speeds some devices can reach, contribute to a growing number of injuries mainly to riders themselves rather than other path users (Haworth et al., 2021). Additionally, the small wheels and limited suspension of micromobility devices make them inherently unstable on uneven surfaces. Combined with inexperience or sensation seeking behaviour, riders may end up crashing, even when travelling at “low” pre-collision speeds of 10km/h.
Visibility is another concern. Because micromobility devices are generally smaller and quieter than vehicles, they can be difficult for drivers to notice, especially at night or in busy traffic. Riders who don’t use lights or reflective clothing are particularly vulnerable in low-visibility conditions.
Regulatory frameworks have struggled to keep pace with the growth of micromobility. Rules around speed limits, helmet use, parking, and age restrictions vary widely between jurisdictions and can be difficult to enforce (Boniface & Horn, 2016). This lack of consistency makes it harder to promote safe riding practices and protect both riders and pedestrians.
Injury data reflects these challenges. Hospitals have reported increases in head and facial injuries, fractures, and other trauma linked to micromobility use (Haworth et al., 2021). Like any vehicle, micromobility devices are subject to reckless use and reckless, or careless parking, which places pedestrians and other road users at risk.
2.4 Powered two and three wheeled motor vehicles #
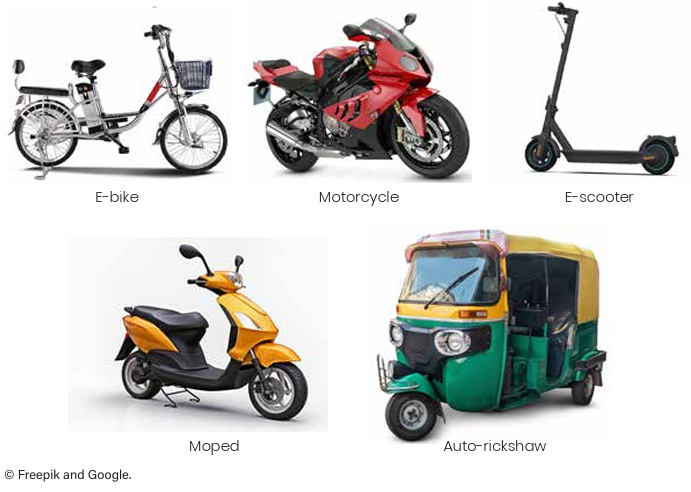
Powered two- and three-wheelers (PTW) can be powered by either an internal combustion engine or electric motor. Examples of PTWs include motorcycles, scooters, mopeds, and auto-rickshaws (Figure 1). PTWs are an important mode of primary transport in many low- and middle-income countries (LMIC) and supplement other transport modes such as walking, bicycling, bus, train, and private car.
Source: Adapted from WHO (2022)
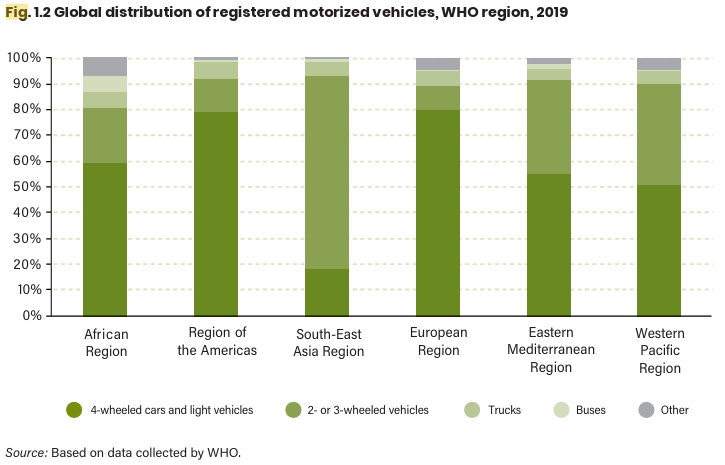
PTWs are prevalent globally. The South East Asian Region has the highest proportion of registered PTWs (~80%), followed by the Western Pacific Region (~40%), Eastern Mediterranean Region (~35%), African Region (~20%), Americas (~12%) and European Region (~10%) (Figure 2).
Source: WHO (2022)
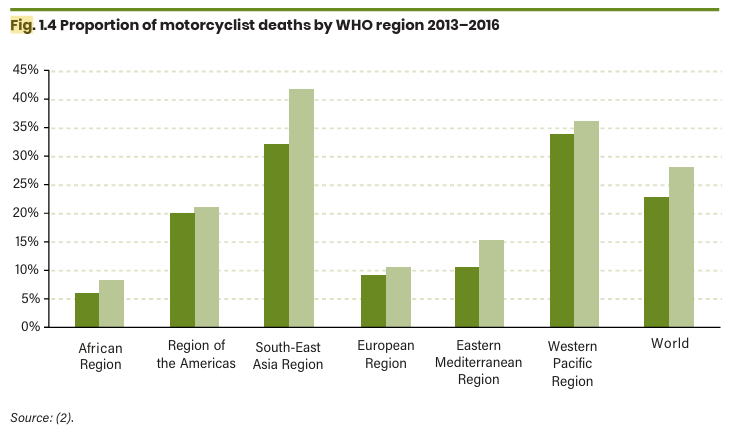
Unfortunately, crashes involving PTWs represent 43% of fatalities in the Southeast Asian Region, 36% in the Western Pacific Region, 15% in the Eastern Mediterranean Region, 9% in the African Region, 23% in the Americas, and 11% in the European Region (WHO, 2022) (Figure 3).
Source: WHO (2022)
Between 2013 and 2016 the proportion of PTW fatalities globally increased from 23% to 28%. This trend was observed in all regions, with the greatest increase of 34% to 43% observed in the Southeast Asian Region (WHO, 2022).
PTWs can be used as personal transport, public transport, commerce, and/or for recreational purposes and this varies across the world. The decision for road users in LMICs to use PTWs is a reflection of affordability, limited public transport options, and traffic congestion (WHO, 2022). In high-income countries the use of PTWs lean more towards recreation; however, this is not to say that they are not used for commuting and commerce (e.g. delivery services).
The main risk factors that contribute to PTW crashes, injury, and fatalities can be grouped under three categories – road environment, the vehicle, and road users. The main crash and injury contributing factors under each of these three categories are discussed below.
2.4.1. Road Environment Risk Factors #
The road environment can often be designed with passenger vehicles in mind resulting in pedestrians, bicyclists, and, indeed, PTW users being considered afterwards. Adding to the challenge is transport planning not sufficiently adapting to the rapid increase in PTW usage in many cities and urban areas (WHO, 2022). This often results in PTWs operating in mixed traffic conditions (i.e., not segregated from much heavier vehicles such as passenger cars, buses, and trucks) (WHO, 2022) thus resulting in a higher likelihood of a serious or fatal injury outcome when a crash occurs.
Lane filtering (where PTWs move between stopped or slow-moving vehicles) and lane splitting, (where PTWs are ridden between lanes of moving traffic, usually at higher speeds than lane filtering) is common in many countries as this reduces traffic congestion and decreases travel time for PTW users. Although there are few studies examining the risk to PTWs of lane filtering and lane splitting, a concern of this practice is associated with the movement of other vehicles into the path of a PTW (WHO, 2022).
Powered two wheelers rely on the user balancing to stay upright. Potholes, metal plate covers, uneven road surfaces, detritus, gravel, and liquid spillage can contribute to destabilising a PTW resulting in a crash. Similarly, roadside furniture and objects pose a greater risk to PTW users than to passenger vehicle occupants, as PTW users lack the crash protection that passenger vehicles provide. These roadside hazards include signposts, bollards, trees, street furniture, utility poles, and drains. A crash into a roadside object is 14 times more likely to result in a fatality than a crash on the ground with no impact with a roadside object (Miggins et al., 2011).
The perceived hazard of wire rope barriers to PTW riders has often been brought up in high-income countries. However, it is noted that in Australia 77% of casualty crashes and 61% of fatalities crashes of all motorcyclists into barriers involve w-beam barriers rather than wire rope barriers. Of all motorcyclists into barrier crashes, wire rope barriers have been implicated in 4% of casualty crashes and 17% of fatality crashes. This equates to 0.04% of all motorcycle casualty crashes and 0.6% of motorcycle fatality crashes. To address motorcyclists into w-beam barrier crash risks, the recommendation is to install rub-rails or post paddings (Grzebieta, 2010).
2.4.2. Road User Risk Factors #
Similar to many other vehicles, the risk factors for PTW riders include riding while alcohol and/or drug impaired, speeding, non-use of helmet, rider age, and rider experience (WHO, 2022). Each of these risk factors are briefly discussed below. Riding under the influence of alcohol and/or drugs has been well established as a risk factor not only for PTW riders but also vehicle drivers. Alcohol and drug impairment is associated with risky PTW rider behaviour such as speeding and not using a helmet (Brown et al., 2009; Rossheim et al., 2014).
The non-use of a helmet while using a PTW has been associated with head injuries, which is a common cause of a fatality and serious injury (WHO, 2022). The purpose of a helmet is to reduce this risk by absorbing some of the impact forces during the crash. However, wearing helmets that have not undergone crash testing and standards certification can also place a PTW user at risk of head injuries. For this reason, it is recommended that PTW users wear helmets which are certified to, ideally, ECE22.05 or AS/NZS 1698.
Excessive speed is the main cause of road trauma in many countries (Ballester et al., 2019; Pai et al., 2018). Higher speeds increase stopping distances, and powered two-wheeler users are particularly vulnerable to injuries in crashes due to their lack of protection. Speed contributes to a higher rate of fatal motorcycle crashes compared to other road users, making it a crucial risk factor for this group (Organisation for Economic Co-operation and Development [OECD/ECMT], 2006).
2.5 Cars and derivatives #
Passenger vehicles make up a large proportion of the motorised vehicle fleet, for example 72% of registered motor vehicles in Australia (Bureau of Infrastructure and Transport Research Economics [BITRE], 2025). They are commonly owned by individuals, but many businesses also own and operate fleets of cars or derivatives such as vans and utility vehicles. Business and private use of cars is broad and varied, serving for example passenger trips, goods and freight, commuting and recreation. Many cars, and especially larger ones are able to tow trailers and caravans. There is some overlap in definitions between very small cars and powered three and four wheelers (for example heavy quadricycles); and at the larger end of the scale very large vans and utility vehicles are structurally more similar to small trucks, with “body-on-frame” construction and high mass. These definitions vary across jurisdictions.
Cars are powerful enough to be capable of high speeds. Unlike other modern powered vehicles such as e-bikes and heavy trucks, cars are generally capable of speeds well in excess of posted speed limits, and vehicle speed limiting is uncommon. As such, cars rely on the driver’s behaviour to comply with speed limits. Multiply this speed with the mass of cars – which can range from under 1000 kg to more than 3000 kg – to arrive at a substantial amount of kinetic energy. The release of this energy over a short time, such as in a crash, results in many of the death and trauma outcomes we aim to prevent.
Speed is a significant factor in causation and severity of crashes, along with alcohol, drug use and seatbelt non-use. Some vehicle technologies have been developed to reduce the occurrence of these, such as seat belt sensors and fatigue alarms, however many of them are still largely determined by driver behaviour.
In an effort to improve driver behaviour, car driving requires a licence. Driver training differs across jurisdictions, with different requirements for minimum training hours and tests. In Australia, this is comprised of a theoretical component on the road rules, manual instruction with a qualified driver, and some form of competency-based test such as exam or logbook. For most drivers, passing this test is only required once in a lifetime, which does not provide a formal means of ensuring ongoing competency nor keeping up to date with road rule and road design changes. The cessation of driving may be a non-voluntary matter handled through the medical system, whereby a doctor advises that a person is unfit to operate a car.
In high-income countries the car is a common choice for household mobility. While cars are not cheap to own or operate, they have become something of a cultural norm in many places. It is common in many high-income countries for households to have more than one car. The relative affordability in some places, coupled with the ability to nearly effortlessly move people and goods have been factors in the rising popularity of cars as economies develop – and the increase in passenger vehicles rising in Australia slightly faster than population (BITRE, 2025).
Many cities around the world have undertaken extensive work allowing cars to move freely. Especially since 1945, a culture of designing and changing cities to be “car friendly” has been pervasive in many cultures, with a result that these same cities are not human friendly, and are now dealing with issues of ill-health, poor liveability, air and noise pollution to name a few (Newman & Kenworthy, 1991). The concept of motonormativity has important consequences for road safety (Newman & Kenworthy, 1989). Congested roads are considered normal, especially during peak periods from 7-9am and 3-6pm. Congestion itself can lead to poor road safety outcomes as drivers become stressed, but conversely may also reduce speeds which increases the time available for a driver to react, and also reduces kinetic energy (Sobhani et al., 2011). This means congestion can also improve safety. Remember that cars are sharing the road with other vehicles such as buses, pedestrians and bicycle riders. In peak times this is a contest for space and can lead road users to make irrational, unsafe decisions. Furthermore, in congested conditions more visual obstructions may occur. Not all cities have taken this path (for example citizens of Utrecht, Netherlands resisted car-oriented planning in the 1950s (Oldenziel et al., 2016), and others besides are reversing car-oriented planning by removing cars from central areas, with Paris being a good example of this work in progress (Allam et al., 2024).
If pedestrians, bicycle and two-wheeler riders are considered vulnerable, then cars probably represent the aggressor, not by the malice of any individual but more by their sheer number, size and mass. Larger cars are a concern because they increase the amount of kinetic energy underway in a vehicle. Battery electric vehicles tend to be heavier than their fossil fuelled equivalents. In a similar vein of reasoning, car occupants can also feel vulnerable, a phenomenon which can be used in the marketing of larger vehicles as safer for occupants. The issue at hand is how roads are expected to be used. In response to the various uses that streets are relied upon for, a ‘movement and place’ framework is commonly used to determine how to design streets most appropriately (Victorian Government, 2025; Brown et al., 2025). The movement and place framework helps to differentiate between types of roads and guides design and decision making on important issues such as speed (Brown et al., 2025). Other means of keeping road users safe include safety systems in cars which can detect impending collisions with other vehicles or pedestrians and apply brakes.
The occupants of cars are also at risk of fatal and serious injury, especially when high speeds are involved. Today’s modern cars contain an array of passive (such as seatbelts, airbags and passenger safety cells) and active (such as electronic stability control, autonomous emergency braking and lane support systems) safety systems to prevent crashes and reduce the severity of impact to the occupant. These are detailed below in sections 4.4.3 and 4.4.4.
2.6. Larger motor vehicles, trucks, buses, trams, truck combinations, trailers, and caravan combinations #
Heavy vehicles, such as trucks, buses, or plant equipment, form a significant part of the vehicle fleet. Light commercial vehicles are 19% of Australia’s registered motor vehicle fleet and there are also several hundred thousand light and heavy trucks (BITRE, 2025). They come in many shapes, sizes and configurations including rigid, articulated and multi-trailer combinations. Each of these has their own dynamic properties which are directly related to their performance on the road and may therefore have implications for their safety. Vehicle mass alone is a significant factor, but to this we can add vehicle complexity and the dynamics of trailers, to issues of driver skill, training, and fatigue, among others. Larger vehicles such as trucks are used mainly for commercial reasons such as freight, which often means they are driven long distances on high-speed roads but must also be able to navigate in tight urban locations such as depots. Caravan combinations are used for recreational purposes and depending on vehicle mass, in some jurisdictions may not require any special licence beyond a car driver’s licence.
Heavy vehicle safety is a critical concern in road transport due to the unique physical and operational characteristics of large vehicles. There are a number of unique safety challenges to consider as described below.
2.6.1. Blind spots #
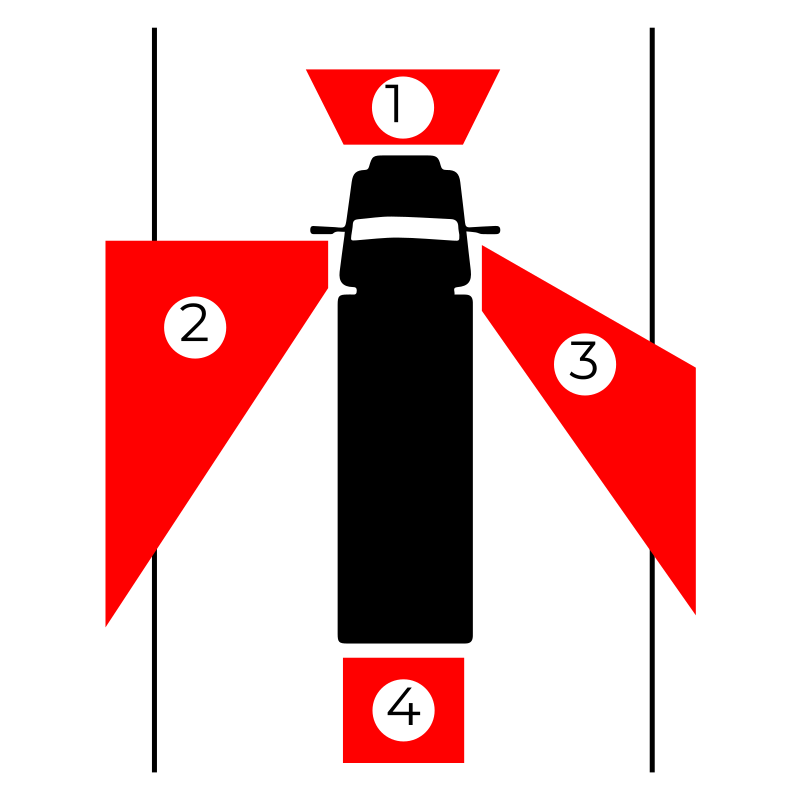
Blind spots are significantly larger in heavy vehicles compared to passenger cars. These blind zones (larger than small “spots”) exist around the front, sides, and rear of trucks and buses, making it difficult for drivers to detect nearby road users, especially pedestrians, cyclists, and smaller vehicles. This increases the risk of collisions during lane changes, turns, and reversing manoeuvres, and highlights the importance of technologies like blind spot monitoring (see Section 4.3.3), Fresnel lenses and proper mirror adjustment.
Source: Transport for NSW (2023)
2.6.2. Acceleration and deceleration performance #
Heavy vehicles require more time and distance to accelerate and decelerate due to their greater mass, higher momentum, delayed brake response, and stability constraints. This affects their ability to respond quickly to changing traffic conditions and can lead to rear-end collisions if other drivers misjudge their stopping capabilities. This presents a particular challenge as heavy vehicles drivers must maintain a larger headway from vehicles in front in order to safely respond to changes ahead. However, drivers may be inclined to cut in front of them should the headway distance seem overly generous.
The acceleration and deceleration performance of heavy vehicles can be particularly exasperated on steep inclines and declines, respectively. On steep inclines, the limited acceleration of heavy vehicles relative to passenger vehicles and motorcycles can result in them impeding the travel lane and forcing other vehicles to overtake, which can be risky in some circumstances. Their limited acceleration may also result in unexpected disparity in travel speeds between the heavy vehicle and other vehicles, thus increasing the risk of rear-end crashes. On steep declines, the brakes of heavy vehicles may become overloaded, overheat, and fail if applied constantly over a significant period.
2.6.3. Vehicle incompatibility #
In crashes, the disparity in size, weight, and structural design often results in more severe outcomes for occupants of smaller vehicles (Department of Infrastructure, Transport, Regional Development and Local Government [DITRDLG], 2009). Without sufficient underrun protection, car bonnets may travel under a truck, with the actual contact with the truck occurring at a more vulnerable location for the vehicle, such as the windscreen.
2.6.4. Turning radius and off-tracking #
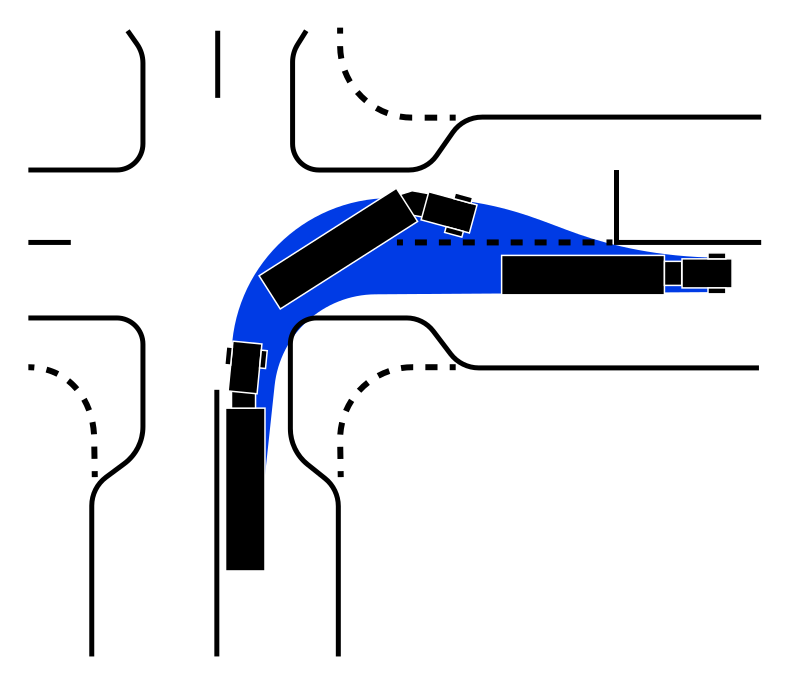
Heavy vehicles require a much larger turning radius than passenger vehicles. During turns, especially at intersections or roundabouts, the rear wheels follow a different path than the front wheels—a phenomenon known as off-tracking. This can lead to encroachment into adjacent lanes or onto pedestrian areas, increasing the risk of collisions unless road geometry is designed to accommodate these movements.
Source: National Association of City Transportation Officials (2026)
2.6.5. Load security and shifting #
Improperly secured loads can shift during transit, affecting vehicle stability and braking performance. Load movement can also lead to rollovers, especially during cornering or evasive manoeuvres. Regulations require specific load restraint systems (e.g., National Heavy Vehicle Regulator [NHVR], 2025), but compliance and enforcement can vary. Overloading or uneven weight distribution further exacerbates these risks, as does a high centre of gravity or loads such as liquids that can move during cornering. The manner in which caravans are loaded and hitched to the tow vehicle is a strong determinant of tracking and stability. Likewise for heavy vehicles, some loads have a naturally high centre-of-gravity – resulting in a risk of rollover. Loading guidance, regulation and driver training can reduce this risk, but not mitigate it altogether.
2.6.6. Ageing vehicle fleet #
Due to the high cost of large vehicles and the economics of commercial operations, the average age of heavy vehicles is typically higher than that of passenger cars. As an example, on Australian roads the average age of passenger vehicles is 11.3 years, compared to over 16 years for heavy rigid trucks and around 12.5 years for articulated trucks (BITRE, 2025). This age disparity raises safety concerns, as older trucks may lack modern safety technologies such as electronic stability control, advanced braking systems, and blind spot monitoring. Additionally, ageing vehicles are more prone to mechanical failures, which can compromise braking, steering, and overall reliability—especially under heavy loads or long-distance travel.
Older trucks also tend to be less crashworthy and may not meet current design standards, increasing the severity of outcomes in collisions, particularly with smaller vehicles (Woodrooffe & Blower, 2015). Addressing these risks requires targeted fleet renewal policies, incentives for upgrading vehicles, and stricter maintenance and compliance regimes to ensure older trucks remain safe and roadworthy.
It is also important to keep in mind when planning the introduction of new heavy vehicle safety standards that any delay in their implementation would have an outsized impact relative to that for the light vehicle fleet, given the age of the fleet and very high utilisation of heavy vehicles.
2.6.7. Driver fatigue and work schedules #
Heavy vehicle drivers often operate under demanding schedules, which can lead to fatigue, a major contributor to crashes (Casey et al., 2024). Long hours, night driving, and insufficient rest breaks reduce alertness and reaction time. While fatigue management systems and telematics can help monitor driver behaviour, cultural and operational pressures in the freight industry may still pose challenges (Casey et al., 2024).
2.6.8. CLOCS (Construction Logistics and Community Safety) #
CLOCS (Construction Logistics and Community Safety) is a Standard designed to manage the risks and impacts associated with construction projects’ on-road transport and logistics activities (CLOCS, 2025). The goal of the Standard is to reduce harm to vulnerable road users, such as pedestrians and cyclists, by encouraging safer vehicles, better trained drivers, more effective logistics planning, and strong community engagement. Initially developed in the UK, the CLOCS Standard has also been emulated Australia (CLOCS-A) – although only as national good practice, rather than as a Standard (CLOCS-A, 2025).
3. Public transport #
3.1. PT vehicles overview #
Public transport systems create economies of space and scale in transport systems, in order to offer services that occupy less space per person, at a scale which makes trips cheaper than some other modes such as the car. This tends to result in public transport vehicles being larger than their private counterparts. For example, buses and trams are longer and wider than even the largest cars. Public transport is often categorised by the right-of-way (ROW) that it uses. Railways are a good example of a separated ROW, and an ordinary bus service of a mixed ROW where the bus drives on the same roads as other vehicles. In between the two extremes are light railways, trams operating under modified streetcar arrangements such as time-based lane closures, or bus systems which provide buses with a head start at traffic lights. All of these public transport modes (including railways, where they cross roads) use vehicles to some extent in the road transport system.
3.2. Special conditions for road safety #
Operating a public transport system often necessitates special road conditions. These special conditions can be isolated or so frequent as to appear continuous. Road users may be more or less familiar with these special conditions depending on their previous exposure. The design of roads to accommodate and enable public transport vehicles tends to be guided by regional or national policy (for example in Australia and New Zealand by Austroads). In practice, municipalities will also play a role in the design and build of these special conditions.
The nature of public transport is to move large numbers of people. At peak times, boarding and alighting from buses and trams can create conditions on roads where groups of pedestrians embark and disembark from vehicles into the road, or on to footpaths. Public transport vehicles often create blind spots by virtue of their size, and cars are a common safety hazard to school children crossing roads immediately after disembarking from a bus. The children are often unaware of other road users, are affected by a blind spot, and may also be of short stature which limits how visible they are. Consider also the case of an elderly passenger climbing down from a tram in the centre of a road, where they must then navigate their way across a busy roadway.
Public transport vehicle lengths result in large turning radii, such that bus interchanges and termini may need to have wider roads than would otherwise be built. These wider spaces take longer to cross and may be vacant for much of the time between services.
Public transport vehicles introduce other infrastructure variations into the road space. Rails for trams, and overhead wires for trams and trolleybuses should be carefully considered for their road safety implications. Tram tracks form a hazard for pedestrians, cyclists and small-wheeled vehicles, especially in wet conditions. Another example is the difficulty in safely routing double decker buses through areas with low overhead bridges or wires. Signals for public transport vehicles are a further variation from normal road transport. On busy bus routes, signal head-start functions are often provided to allow a bus to keep to time; however, these movements can be unexpected by other road users. Similarly, urban areas often contain roads which are for the sole use of public transport vehicles. A pedestrian expecting to cross the road when cars stop may be surprised to see that the bus has a green light.
3.3. Railways and level crossings #
Where railways and roads intersect at the same level (i.e. without grade separation like a bridge) a crossing is designed to permit the train to pass. Level crossings essentially create a temporary ROW corridor for the train by closing the road. In some parts of the world canal level crossings such as opening bridges are more common than railways, but they perform the same essential task. Level crossings, bridges and gates that open and close introduce more moving parts into the already complex road transport system; this complexity must be carefully handled lest it become a hazard.
Since travel is a time-bound activity, the temporary closure of a road inevitably causes delay, which can be a cause of frustration for road users. As safe as a level crossing may be, the behaviour of road users is known to include a small number of users who will walk, run, drive or ride through a closed barrier or red light (Larue & Naweed, 2020).
4. Vehicle designs #
4.1. Standards #
Most high-income countries apply vehicle construction standards for new vehicles, and also in-service standards that control (to some extent) ongoing safety performance of vehicles once in use. The majority of such countries, including all European nations, Japan, China, and Australia, apply a “Type Approval” system, that requires new vehicles to be tested and certified against a set of regulatory norms before they can be supplied to consumers. Most of the remaining nations, including the USA, Canada and South Korea, apply a ‘self-certification’ approach – where products supplied by a manufacturer must meet specified standards, but testing is conducted by regulators on a surveillance basis – generally with penalties or remedies in place if non-compliance is detected.
The UNECE, through its World Forum for Harmonization of Vehicle Regulations (WP.29), develops international standards for vehicle safety and technology (UNECE, 2025). The 1958 “Agreement concerning the Adoption of Uniform Technical Prescriptions for Wheeled Vehicles, Equipment and Parts and the Conditions for Reciprocal Recognition of Approvals”, was established by the UNECE (UNECE, 2025). Through signing onto this agreement, countries recognise UNECE regulations and seek to align their own national standards (e.g., Australian Design Rules, India Automotive Industry Standards) with these international standards, supporting global harmonisation. Further supporting international harmonisation, the UNECE 1998 “Agreement Concerning the Establishment of Global Technical Regulations for Wheeled Vehicles, Equipment and Parts”, sets out an intention to align national standards with Global Technical Regulations (GTRs) (UNECE, 2025).
Building on these global frameworks, the European General Safety Regulation (GSR II), formally known as Regulation (EU) 2019/2144, mandates a wide range of advanced safety technologies in all new vehicles sold in the European Union (European Commission, 2025). Effective from July 2022 for new vehicle types and July 2024 for all new vehicles, GSR II aims to significantly reduce road fatalities and serious injuries by requiring features such as Intelligent Speed Assistance (ISA), Autonomous Emergency Braking (AEB) with pedestrian and cyclist detection, Lane Keeping Assistance, Event Data Recorders (EDRs), and driver drowsiness and distraction monitoring systems. These technologies are designed to address common causes of crashes and improve protection for both vehicle occupants and vulnerable road users.
GSR II supports the EU’s Vision Zero strategy, which seeks to eliminate road deaths by 2050 (European Climate, Infrastructure and Environment Executive Agency, 2025). While it complements the UNECE’s existing vehicle regulations, GSR II goes further by mandating specific technologies across all vehicle categories—including passenger cars, vans, trucks, and buses – and also supports the development of automated and connected vehicles by laying the groundwork for future safety standards.
4.2. New Car Assessment Programs #
New Car Assessment Programs (NCAPs) provide objective vehicle safety information to consumers assisting them in choosing vehicles that have greater safety performance. In turn this encourages manufacturers to produce safer vehicles and provides early insight into the performance of advanced safety systems. The first New Car Assessment Program was launched in 1979 in the US by the National Highway Traffic Safety Administration (NHTSA) with the goal of encouraging manufacturers to develop safer vehicles (Hershman, 2001). The initial assessments under US NCAP focussed on applying tests that were part of the US Federal Motor Vehicle Safety Standards (FMVSS), but with more stringent scenarios such as higher speeds. Other NCAPs were founded in other countries over time as shown in Table 2 below (Global NCAP, 2025).
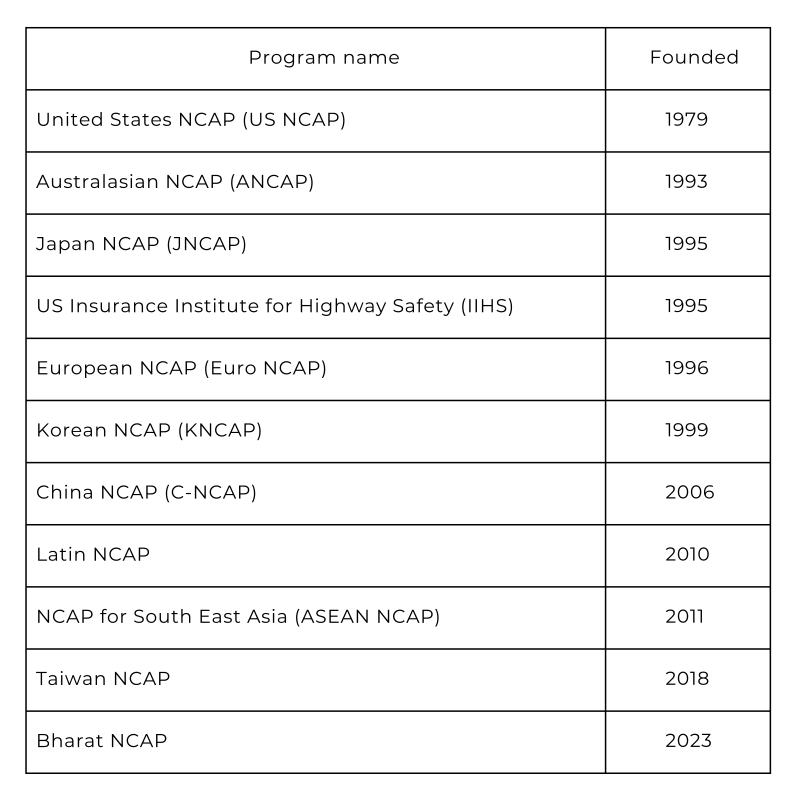
Source: Global NCAP (2025)
Each NCAP develops their own set of assessment protocols, typically with regard to the most common crash types or circumstances in their area of operation. Although, some NCAPs have sought to harmonise their assessments over time, such as ANCAP and Euro NCAP (ANCAP, 2025).
A key feature of most NCAPs is the presentation of an overall star rating for a vehicle that has been assessed. Given the complexity of vehicle testing, and the wide range of tests that are applied across different aspects of safety, it is acknowledged that the general public are unlikely to interpret the results comprehensively. As such, a summary result, on a scale of 0 to 5 “stars”, is provided to give a clear indication of the overall safety of a vehicle that has been assessed (Euro NCAP, 2025).
In general, NCAPs are more agile than vehicle design standards, in that testing and assessment protocols can be more frequently updated and expanded in response to the emergence of new vehicle safety technologies or capabilities. As an example, Euro NCAP typically reviews and updates their assessment protocols every three years, resulting in the introduction of new tests and the application of more stringent performance requirements (Euro NCAP, 2022).
The reason for greater agility in NCAPs is that they are usually somewhat independent from either government or manufacturers. One notable exception to this, is US NCAP which is still managed by NHTSA. It has been observed that this government oversight has resulted in the US NCAP assessment protocols falling well behind those of other NCAPs (National Transport Safety Board [NTSB], 2025). However, an independent NCAP for the US vehicle market was established by the Insurance Institute for Highway Safety (IIHS) in 1995, which applies a more comprehensive and stringent set of assessment protocols compared to US NCAP (IIHS, 2025).
4.3. Crash avoidance technology #
4.3.1. Crash avoidance technology #
Crash avoidance technologies have developed rapidly across a range of vehicle types. While most technologies are introduced first to passenger cars (often initially in high-end or luxury cars), many technologies offer the same or even greater benefits for other vehicles such as trucks, vans and motorcycles.
Typically, these crash avoidance systems require sensing of an impending ‘threat’, provide an alert or warning to the driver, and in most cases, some form of intervention, to avoid or mitigate a crash. These systems generally intervene autonomously, but to support or assist the driver, rather than assuming full control of the vehicle. While self-driving, or autonomous vehicles are expected to appear in the medium-term future, currently all mainstream crash avoidance systems rely on a driver remaining ‘in control’ of the vehicle and maintaining responsibility for the vehicle’s operation (National Transport Commission [NTC], 2025).
While crash avoidance systems are developed and tested to perform effectively, they are not infallible and are known to suffer from false positives (i.e., activate when there is not an imminent threat of a collision). Often this is an activation that occurs in response to a potential threat that does not evolve into a critical situation. However, from the perspective of the safety system, there is also risk in waiting too long to activate, as it may then mean there is not enough time remaining to avoid a serious collision (i.e., a false negative result). This is the fine line that must be negotiated by the designers of crash avoidance technologies. It might be suggested that some false positive activations are acceptable if that means false negatives are avoided. However, a significant number of false negatives will erode the trust of drivers, can become annoying, and may result in safety systems being switched off which means they are not available to intervene when a critical situation does occur (Kim & Oviedo-Trespalacios, 2025).
Crash avoidance systems can be divided into lateral control (maintaining a vehicle’s position within a lane) and longitudinal control (braking or accelerating the vehicle). Over a short time, the number and complexity of the scenarios in which these systems can intervene have increased significantly (ANCAP, 2021). There are many distinct crash avoidance systems, but three of the main examples are described briefly below. Other types of collision avoidance systems include back-over avoidance, blind spot monitoring, and speed assistance.
4.3.1.1. Electronic Stability Control (ESC) #
ESC constantly monitors the yaw rate of a vehicle (the rate of rotation around the centre of mass) and compares this to the steering wheel input being provided by the driver. If a potential mismatch is detected as imminent, either due to under-rotation compared with the steering input (understeer) or an over-rotation compared with the steering input (oversteer), then the system will provide a corrective response by applying braking to individual wheels. In an understeer situation, braking the inside rear wheel will assist with increasing rotation. In an oversteer situation, braking the outside front wheel will assist with countering rotation.
ESC responds very rapidly, without any input or confirmation from the driver. As such, many drivers may be unaware that the system has been engaged and prevented a potential loss of control. Lie et al. (2006) found that ESC was able to prevent around 25% of injury crashes and up to 50% of loss-of-control type crashes.
4.3.1.2. Autonomous Emergency Braking (AEB) #
AEB can support the driver by applying braking in situations where the driver has not seen another vehicle or road-user, or does not react in sufficient time to prevent a collision. AEB uses sensors, including single and multiple cameras or radars, to identify other road users, analyse their trajectory, and evaluate whether a collision is likely. In combination with notification to the driver (e.g. Frontal Collision Warning), the AEB can apply braking as necessary to avoid impact. Early systems operated at slower speeds, and operated in vehicle front-to-rear collisions. With increasing capability of sensing, this has now expanded to a wide range of potential collision partners – including adult and child pedestrians, bicycles, motorcycles and trucks. The crash scenarios include front-to-rear, turn-across-path, reversing and head-on.
Early studies found that AEB was able to reduce the risk of front-to-rear injury crashes by up to 56% (Cicchino, 2017) and the risk of pedestrian injury crashes by up to 30% (Cicchino, 2022). Although, AEB performance in avoiding pedestrian collisions is reduced in low-light and nighttime situations (Moradloo et al., 2025). It is also worth noting that AEB is not designed to respond to static roadside objects, so is unlikely to be effective in crashes when a vehicle drifts off the roadway and (for example) collides with a tree.
4.3.1.3. Lane Support Systems (LSS) #
Lane Support Systems aim to keep a vehicle within the intended travelling lane, either through driver warning, steering intervention, or both. Crashes resulting from unintended lane departures have been estimated to cause 42% of fatal crashes in Australia (Newstead et al., 2023). The same study attributed a 22% reduction in casualty crashes, and a 16% reduction in fatality crashes to vehicles fitted with Lane Departure Warning and Lane Keep Assist systems. As with other crash avoidance systems, Lane Support Systems have evolved to address an increasing range of crash types. Earlier systems provided relatively passive intervention in vehicle control, either by alerting the driver, or gentle steering input. More recent systems (including Emergency Lane Keeping) will generally act with greater steering authority, and be able to prevent lane departure in more complex scenarios, such as unmarked road edges, intentional and unintentional lane changes, and lane changes with oncoming traffic.
4.3.2. PTW crash avoidance technology #
PTW crash avoidance technology, also known as Advance Rider Assist Systems (ARAS), significantly lags that in light vehicles. Crash avoidance technologies have been available in vehicles for several years and decades; however, they have only started to become more widely available for PTWs relatively recently. Despite these crash avoidance technologies having the potential to reduce FSI crashes, their uptake in many high-income countries remains limited, and is even more restricted in low- and middle-income countries. The reasons for this lag are several and include:
- Electronic control modules were initially large and heavy thus could not be easily fitted to PTWs. Advancement in technology has resulted in these modules becoming smaller and lighter thus more compatible with the restricted space on PTWs.
- The cost of these technologies as a percentage of manufacturing expenses is significantly higher for PTWs compared to passenger vehicles. However, manufacturers’ ability to adapt systems from larger vehicles to PTWs has reduced the costs associated with these systems. Additionally, the manufacturing costs for these technologies have decreased over the years, making them commercially viable for installation in PTWs.
- UNECE and various national vehicle design regulations have prioritised vehicle safety, leading many high-income countries and some low- and middle-income countries) to mandate several ADAS. In contrast, the implementation of ARAS has been slower, with Anti-lock Braking System (ABS) only recently becoming mandatory in a limited number of HICs and even fewer LMICs.
ARAS can be classified into three categories: alert, intervening, and convenience (Table 3) and are explained in turn below:
- Alert Type ARAS are designed to warn riders of potential hazards and rely on the rider taking evasive action. Examples of this type of ARAS are Blind Spot Detection/Monitoring (BSD/BSM), Forward Collision Warning (FCW), and Rear Collision Warning (RCW).
- Intervening Type ARAS alerts the rider and intervenes to avoid or reduce the severity of a crash. These types of ARAS fall into two sub-categories:
- Rider-activated systems which require the rider to engage the system before it operates. Examples include Adaptive Cruise Control (ACC), Cornering Electronic Combined Brake System (C-ECBS), and Riding Distance Assist (RDA).
- Autonomous systems which operated independently of rider input. Examples include Autonomous Emergency Braking (AEB), ABS (Anti-lock Braking System), C-ABS (Cornering Anti-lock Braking System), and Electronic Stability Control (ESC)/Motorcycle Stability Control (MSC).
- Convenience ARAS which are intended to enhance rider comfort with limited, if any, impact on safety. Examples of such systems are Hill Hold Assist (HHA) and Adaptive Cruise Control with Stop-Go (ACC-Stop-Go).
Some ARAS features do straddle multiple categories and include Group Ride Assist (GRA). GRA detects if a rider is riding in group formation and can apply the brakes autonomously if it detects that the head distance has been reduced from the preset distance.
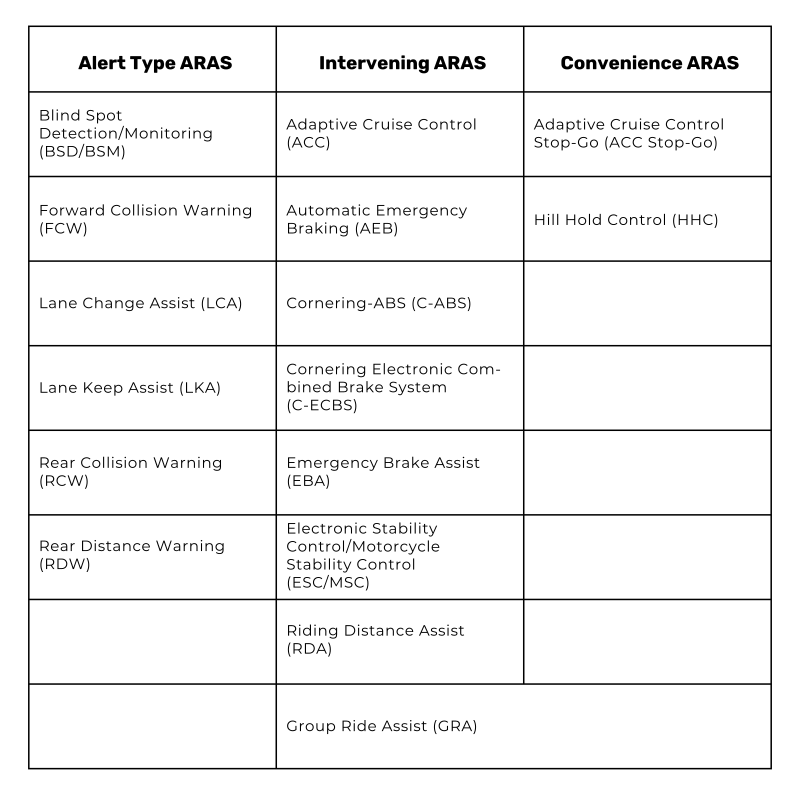
Source: Authors (2026)
Of all ARAS, ABS is the most studied. Real-world studies have reported ABS reducing injury crashes ranging from 24% in Italy to 29% in Spain and 34% in Sweden (Rizzi et al., 2015). An Australian study found that ABS resulted in a 33% reduction in all injuries and 39% reduction in severe injuries in relevant crash types (Fildes et al., 2015). The real-world effectiveness of motorcycle ABS in low- and middle-income countries has, unfortunately, not been studied.
Real-world studies on the effectiveness of motorcycle ESC/MSC has been performed in Sweden which found that ESC/MSC reduces fatal crashes by 5% (Transportstylrelsen, 2013). Further studies on the effectiveness of ESC/MSC and the other ARAS listed in Table 3 would be valuable.
4.3.3. Heavy vehicle crash avoidance technology #
Heavy vehicles generally benefit from the same crash avoidance technologies as light vehicles. However, there are some aspects of heavy vehicles that increase the complexity of implementing such technologies. The first is the size and weight of heavy vehicles which means that crash avoidance systems must be tuned to respond differently – e.g., AEB would respond more rapidly to account for longer stopping distances. Secondly, heavy vehicles often consist of a ‘truck and trailer’ combination which can result in incompatibility issues. To function properly, many safety technologies need to be implemented on both the truck and trailer. A truck with a smart technology may not function, or only function to a limited extent, when paired with a ‘dumb’ trailer (and vice-versa). Additionally, even when both a truck and trailer with the same technology are available, the driver must often take the time to physically connect the systems together via cables. This can be forgotten, or some drivers may not be trained or confident in connecting the cables correctly.
4.4. Crash protection technology #
While safety became a consideration in design fairly early in the development of motor cars, crash protection systems have evolved significantly since the 1950s. In this time the focus has slowly moved from looking at just the occupants of the vehicle, or even just the driver, to considering a range of potential collision partners, including other vehicles, pedestrians and cyclists. However, the principles of preventing injury and death remain the same. These principles were originally developed by DeHaven in 1968, and he demonstrated them through an analogy to packaging (DeHaven, 1969):
- The package shall not open up and spill its content and should not collapse under expected conditions of force and thereby expose objects inside to damage.
- Packaging structures which shield the inner container must not be made of brittle or frail materials; they should resist force by yielding and absorbing energy applied to the outer container so as to cushion and distribute impact and thereby protect the inner container.
- Articles contained in the packaging should be held and immobilised inside the outer structure.
- Wadding, blocks or means for holding an object inside a shipping container must transmit forces to the strongest parts of the contained objects.
The desire to achieve zero fatal and serious injuries (FSI) on roads has pushed the development of new technologies, while at the same time vehicles have become increasingly computerised, with technology developments enabling new safety solutions that are in advance of regulation or consumer expectations.
4.4.1. Mechanisms of injury in crashes #
Our understanding of road safety outcomes stems largely from advances in medical science. As such, we have a more detailed understanding of what causes injury, with injuries from vehicle crashes generally falling into one of three categories.
The first type of injury is from forces due to sudden acceleration. The organs of the human body are not rigid. They are able to move within the body. Similarly, parts within an organ, such as the brain, are able to move relative to each other. When the body is accelerated during an impact, these parts may experience relative movement, which can lead to rupture or other damage within an organ, or between organs. For example, an impact to the head will cause acceleration of the skull. The soft brain can then impact the interior of the skull, which in turn can cause rupture of blood vessels or shearing within the brain material.
The second type of injury is from force beyond the structural capacity of bones. The human skeleton has a role in providing mobility, but also in protecting the internal organs from damage. As with all structures, there is a limit of the force in compression, tension or bending that each bone can withstand. Once a bone (or group of bones, such as the spine) is broken, it may be unable to protect the organs, or may be unable to provide mobility. In some cases, the damaged bone itself may cause rupture or puncture of organs or of critical blood vessels.
The third injury mechanism comes from a crushing reduction in the space the human body requires to survive. Crashes that compromise a person’s survival space can lead to insufficient room to breathe, or can restrict the flow of blood around the body resulting in a crushing-type event. Ensuring survival space is therefore paramount to protection of a vehicle’s occupants.
Beyond these mechanisms, other events or factors may influence the survivability of a crash – for example fire may lead to asphyxiation or burn injuries, submergence may lead to drowning, and penetrating injuries may be caused by objects either outside or inside the vehicle.
4.4.2. Measuring injury risk #
In order to make vehicle designs safer, an important step is to quantify the risk of injury that results from a crash. Human tolerance to impact of various types is quantified from a range of sources, including testing on volunteers, cadavers, animal specimens and more recently through computer modelling (“Human Body Models” – which in turn draw data from the other sources).
4.4.2.1 Anthropomorphic Test Devices (ATDs) – Crash Test Dummies #
The primary tool for measuring occupant injury in a crash is the so-called Crash Test Dummy – a simplified human form that shares a range of physical attributes with a real human, but is able to collect data that can be used to assess the risk of injury. As with vehicle safety, dummies have evolved over time, from basic dummies that are essentially human-shaped ballast, to highly complex devices capable of measuring 150 or more channels of data during a crash test (ANCAP, 2024).
ATDs are typically categorised by size, and by function – most dummies are typically designed for use in specific types of impact – for example, side impact, frontal impact, or rear impact. This is because the sensors installed in the dummy, and mechanical components in the ATD, are usually oriented for loading from one direction – and have limited measurement capability in other directions.
It is important to recognise that no matter how human-like an ATD may appear – they are very much a simplification of the human body. They need to be able to collect data in a test, and also respond to the crash loads in a manner that is similar to a human – however they also need to remain intact, and able to collect data throughout the impact. ATDs typically have a rigid spine, with some flexibility at the neck and pelvis. Most dummies have movable ribs – but the ribs’ shape and structure are simplified compared to a real human (Shaw et al., 2000). ATDs will usually measure accelerations, forces or moments at various points in the body. As compression of the ribs is also an important metric for chest injury, most frontal and side impact dummies also measure the deflection of the ribs. Different ATDs are typically designed and used for different types of collision scenarios as shown in Table 4 below.
| Collision scenario | ATD |
| Frontal impact | Hybrid II, Hybrid III (5th, 50th 95th percentile), THOR (50th and 5th percentile) |
| Side impact | Euro SID, ES-2 (Euro SID 2, inc ES2-RE), WorldSID 50th percentile |
| Rear impact | BioRID |
| Child | Q Series (Q0, Q1, Q1.5, Q6, Q10) (Front and Side Impact) P Series (P¾ , P1.5, P3, P6, P10) Hybrid III (3yo, 6yo, 10yo) CRABI |
Source: Authors (2026)
4.4.2.2. Differing tolerance to impact injury #
Not all humans are the same, and their tolerance to the effects of vehicle crashes can change with gender, age and stature. In particular, as people age, their bones become weaker and more prone to fracture (Zioupos et al., 2020; Royal Osteoporosis Society, 2026; John Hopkins Medicine, 2026). This means that the crash forces that can be withstood by a younger, healthy person are likely to be much higher than for an older person (Newgard, 2008; Hanrahan et al, 2009). The seatbelt that effectively restrains a younger person may be a source of critical injury for an elderly person. Similarly, a head restraint that is designed to protect a mid-size person may be too high for a person with shorter stature, or too low for a person that is tall. Higher body mass can also increase the risk of soft tissue and other impact injuries.
Consequently, vehicles must be designed for a range of occupants. Modern restraint systems can reduce this variability with load-limiting seatbelts, multi-stage airbags with occupant sensing (size and position). These systems became widely fitted in North America, initially to address the challenge of protecting unrestrained occupants while decreasing risks to short statured and out-of-position persons. More recently, advanced restraints are being encouraged through NCAP programs (ANCAP, 2026) to provide robustness of protection for a range of occupant size, stature and crash severity.
4.4.2.3. ‘Gender’ of crash dummies #
The anthropometric and biomechanical data that has been used to define the dummies that are in use has not generally been taken from one gender or another. Data is taken from a range of subjects of different stature and gender, and can then be scaled or adjusted to estimate the behaviour and injury tolerance of a smaller subset of the population. So, for example, the characteristics of the 50th percentile “male” dummy that has been in use for decades, have been developed from data on male and female subjects, with a range of size and age. The dummies are structurally much simpler than the human form – their spines are rigid (or close to rigid) and they do not have organs. Rather, the dummies measure the forces and accelerations for different regions of the body, which can in turn be used to estimate likely injury risks for a real human.
In some cases, injury criteria may also be adjusted to establish injury risk for different occupants, such as older persons, that have a higher risk of bone fracture or organ damage than, say, a younger person.
Dummies representing female occupants have been used in NCAP and regulatory crash testing for many years. Since the start of 2018, ANCAP has included a small adult 5th percentile female dummy (Hybrid III 5F) in the full-width frontal crash test, in both the driver and left-rear passenger positions. This test focuses on seatbelt and airbag performance, and smaller occupants can be more challenging to protect due to differences in seating position and belt geometry. The Hybrid III 5F dummy is also used in regulatory tests in the USA, under Federal Motor Vehicle Safety Standard 208 (NHTSA, 2025).
Details of a new small statured dummy, the THOR-05F, have been published by the US National Highway Traffic Safety Administration (NHTSA, 2026). It is likely that this new tool will be applied in future NCAP and regulatory tests.
4.4.3 Crash protection for vehicle occupants #
4.4.3.1. Structure #
Structure is critical in maintaining the survival space, providing a relatively rigid ‘cell’ for vehicle occupants. The vehicle structure also provides the energy absorption that is essential to reduce the peak acceleration of the vehicle and therefore minimise the forces acting on the occupants.
In modern vehicles, good structure is achieved through careful design of components including the firewall, footwells, sills, roof, doors and pillars. Use of high strength steels and multi-layer sections created with advanced forming techniques mean that strength improvements can be achieved without necessarily increasing mass (Hu & Feng, 2021). Structural elements are designed to deform in a controlled way, to absorb energy without causing intrusion into the occupant cell (“crumple zones”, side intrusion bars).
While noting the above, it is acknowledged that vehicles range in size, height, mass and stiffness. As a result, smaller and lighter vehicles will undergo higher accelerations when crashing into a large vehicle. Larger vehicles have more space within which to absorb energy, but if they are stiffer than the collision partner, they will absorb less. In addition, if the crash structures of two vehicles do not effectively engage with each other, neither will work properly – increasing the risk of injury in both vehicles (Wykes et al., 1998).
Vehicle compatibility aims to ensure that vehicles maximise the protection of occupants provided by good structure, by promoting designs that spread crash loads across the width and height of a vehicle and ensure a ‘common interaction zone’. For good compatibility, smaller vehicles need to be stiffer, to minimise intrusion and take advantage of a larger vehicle’s energy absorption. Larger vehicles need to ensure that they can absorb more energy from the collision partner, without compromising protection of the occupants.
Recent crash tests, such as the “Mobile Progressive Deformable Barrier” test, employed by Euro NCAP and ANCAP, are designed to encourage compatibility – representing a collision with a partner of medium mass (ANCAP, 2024). The vehicle under test is impacted by a moving ‘trolley’ that is mounted with a deformable element – assessment of which provides information about the vehicle’s front structure, including structural uniformity.
4.4.3.2. Seatbelts #
The role of the seatbelt is to ‘couple’ the occupant to the vehicle, to avoid impact with the vehicle interior and to prevent ejection from the vehicle. Early seatbelt designs, in particular lap-only (or 2-point) belts helped prevent ejection, but provided little protection from impacts with the vehicle interior. The lap-sash, or 3-point belt, introduced in 1959, provides much better restraint of the occupant, and control of the torso – reducing impacts with the steering wheel, instrument panel or other interior parts (Håland, 2006; Volvo, 2026).
In order to be effective, the belt must be correctly adjusted. The inertia reel seatbelt, which became widespread in the 1970s allowed the belt to ‘self-adjust’ and remove any slack from the belt webbing. Emergency locking retractors reduce payout of the belt during a crash. Similarly, a pyrotechnic belt pre-tensioner can further reduce slack, spooling the belt in when a crash is detected (Håland, 2006).
Modern seatbelts also provide an additional function of energy absorption – trading a controlled amount of excursion within the vehicle to reduce peak loading on the occupant’s body (“load limiting”). These features work in conjunction with airbags (below) to optimise the ‘ride-down’ of the occupants.
4.4.3.3. Airbags #
Airbags first appeared in production cars in the early 1970s (Viano, 2024). These were initially introduced in the United States, intended as an alternative to using a seatbelt. While airbags may provide some injury reduction for the unbelted occupant, the greatest benefit is in the combination of seatbelt and airbag – where the belt can control the location and motion of the occupant, while the airbag provides energy absorption and best use of the available survival space to minimise acceleration and to prevent impact with the interior.
Steering wheel mounted driver airbags were the first to become widely available – with the steering wheel providing both a location for storage of the uninflated airbag, and a relatively rigid frame against which the airbag could deploy. Driver’s airbags have been shown to reduce the risk of a (belted) driver fatality by 22% (Høye, 2010).
Once driver’s airbags were relatively common, passenger airbags started being introduced, offering similar protection (in frontal crashes) to that on the driver’s side.
In protecting the occupant, side impact crashes present a different challenge than frontal crashes. There is very little space between the impacting vehicle or object, and the occupant. An airbag can assist in distributing forces, and reducing accelerations. The airbag can also help by initiating motion of the occupant away from the intruding vehicle side. However, the amount of time available between the start of the crash, and impact with the (struck side) occupant is very small – so side airbags must inflate early and quickly.
Early side airbags protected the thorax of the occupant, in particular reducing concentrated loading of the ribs. However, the greatest benefit in side impact protection comes through protection of the head (Fitzharris et al., 2011). Head injuries in side impacts are typically very high severity (fatal or serious brain injury), usually from either direct contact between the head and the impacting object (e.g., vehicle or pole), or with the vehicle interior. Therefore, the introduction of head-protecting side airbags (starting from the late 1990s) represents a very important step in occupant protection (Fitzharris et al., 2011). The early ‘inflatable tubular structure’ design for head protection was overtaken by the now ubiquitous side-curtain airbag. Some curtain airbags can also mitigate rollover crashes, by preventing full or partial ejection.
While most serious injuries in side impacts are to the occupants on the struck side of the vehicle, there remains a significant injury risk to occupants on the non-struck side (or ‘far side’) of the vehicle. Injuries can be caused by impact with the intruding door or vehicle side, or from interaction between two occupants (e.g., head-to-head contact) (Heudorfer & Kraft, 2009). “Centre airbags” deploy between the front seats, usually from the driver’s seat. The primary role of the centre airbag is to keep the occupants from moving across the vehicle and impacting the struck side. The secondary role is to prevent occupant-to-occupant contact. Since first becoming widely available in 2020, centre airbags are now fitted to the majority of new cars sold in developed markets such as Australia, New Zealand and in Europe.
4.4.4 Crash protection for road users outside the vehicle #
While occupant protection features may mitigate injuries in a crash for those inside the vehicle, protecting vulnerable road users (VRUs) outside the vehicle, such as pedestrians, cyclists and motorcyclists presents a different challenge. The biomechanical principles remain the same as for occupants – minimising acceleration of critical body parts, and limiting forces applied to the skeleton and organs. However, the difference in speed, mass and stiffness between a passenger (or commercial) vehicle and a vulnerable road user are such that opportunities to reduce injury are limited and can only really be effective at speeds below 40km/h (Niebuhr et al., 2016; Nishimoto et al., 2019).
Vehicle designs for improved protection of pedestrians evolved over many years, but measurable progress really started with the introduction of testing tools in the early to mid 1990s (McLean, 1996). The complex interaction between a vehicle and a pedestrian (or cyclist or motorcyclist) is very difficult to reproduce. Therefore, most test tools have been developed as ‘sub-systems’ tests – separately examining the risk of injury to the head, torso and legs of a VRU. These tests can then be applied to the parts of a vehicle most likely to impact those body regions. Testing has focused on the front of the vehicle (including windscreen), being the predominant point of impact.
A vulnerable road user’s head will typically impact the bonnet (or windscreen for cyclists) of a striking vehicle. Protection can be improved by reducing or avoiding hard points underneath the outer surface of the vehicle, giving space for the head to ‘ride down’ with reduced peak acceleration (McLean, 1996).
Some hard points are unavoidable, such as the windscreen pillars – for these areas, some vehicles have been fitted with pedestrian-specific airbags. These devices deploy from the outside of the vehicle when a pedestrian impact is detected, and work in the same way as internal airbags, to absorb energy and reduce acceleration of the head of the VRU. Larger vehicles, and those with a flat frontal profile (e.g., vans) can present greater risk to vulnerable road users – as the head may impact directly with vehicle front structures that have minimal potential for energy absorption.
While head injuries are the predominant cause of pedestrian fatality, injuries to the legs (including knees) are highly debilitating and difficult to treat. As with the head, there are countermeasures that can reduce leg injuries. These include energy absorbing components in the vehicle front, as well as changes to the vehicle’s shape. In some markets (Japan, EU, UK) regulatory measures are in place to control ‘pedestrian friendliness’ of vehicle front structures. There is currently no such requirement in Australia or the USA – however in Australia’s case a large majority of vehicles offer reasonable protection as a result of ANCAP’s testing and rating program.
4.4.5. Crash protection for PTW users #
PTW users are classed as Vulnerable Road Users (VRU) due to the limited protection they have in a crash with another vehicle. The generally accepted maximum impact speed of a motorcycle is 30 km/h for serious injury crashes and 50 km/h for fatal crashes (Strandroth, 2025; Perticone, Barbani & Baldanzini, 2023).
Unlike passenger vehicles PTWs do not have a crash structure to protect users. PTW users are very much reliant on crash avoidance technologies to reduce the likelihood of a crash occurring and the risk of a FSI outcome if the crash cannot be mitigated. In the event that a crash does occur PTW users are then reliant on PTW Personal Protective Equipment (PPE) to protect them. These include helmets, jackets, airbag vests, gloves, trousers, and footwear.
PTW jackets, gloves, and trousers are generally designed to protect against abrasion and impact. Abrasion protection is achieved through the chosen material with which the PPE is made and aims to minimise the risk of cuts and gravel abrasion when contacting the road surface or other objects. Common materials include leather, high-density ballistic nylon, and para-aramid (e.g., Kevlar). Impact resistance is achieved through armour inserted in locations frequently impacted in crashes. They are designed to absorb and spread impact forces over a greater area thus reducing the risk of injuries such as bone fractures and joint damage. The two standards that are applicable to PTW armour in Europe are EN1621-1 and EN1621-2. The former relates to armour for the protection of elbow, knee, shoulder, and hip while the latter for the back and spine. The International Standards Organisation (ISO) equivalent of these two standards is ISO23631-1 and ISO23631-2 while the United States rely on the American Society for Testing Material’s ASTM F1492-19 standard.
PTW helmets are designed to protect the user’s head from abrasion and impacts during a crash. Helmets generally consist of two layers – a hard energy absorbing shell, often made from Acrylonitrile Butadiene Styrene (ABS) or polycarbonate fibre glass, and a deformable liner, often polystyrene foam, that also absorbs energy. There are three main styles of helmets: full-face, open-face, and flip-face. The former is generally the recommended style of helmet as it provides better crash protection than open-face and flip-face helmets.
MotoCAP (the Motorcycle Clothing Assessment Program) was established in 2017 by a consortium of government and private organisations across Australia and New Zealand with the aim of empowering PTW users to choose the right PPE to provide them with the best level of protection and comfort (MotoCAP, n.d.). As of 2025, MotoCAP conducts tests on jackets, trousers, and gloves available in Australia and New Zealand and publishes the results on their website. Helmet ratings for helmets available in Australia and New Zealand are conducted under a separate program, known as CRASH, with the results also published on the MotoCAP website.
5. Maintenance #
As introduced above, vehicles can be owned by private individuals and businesses. The owner of the vehicle is responsible for ensuring the vehicle is roadworthy, but the concept and enforcement of roadworthiness varies by jurisdiction and vehicle type. A further complexity is that many private vehicles are used for business purposes (the so called “grey fleet”). This can make the onus of maintenance more complex.
5.1. Bicycles and other cycles #
The relative simplicity and scale of bicycles makes routine maintenance accessible to users who are willing and able to learn it. It is common for pre-teens to understand and maintain their own bicycles, but also common for capable adults to rely on a bike shop for the same. Some elements of bicycle maintenance are directly related to safety, such as brakes and steering. Checking these functions regularly is taught to some children through bicycle and outdoor education at school, but this very much depends on the prevailing culture and varies widely around the world. A common mnemonic for bicycle maintenance is ABCDEQ; air, brakes, chain, drop-test (to detect loose parts), (handlebar) end caps and quick-release (holding on wheels). While bicycles are required to meet safety standards at sale, they can rapidly deteriorate in use through their duty cycle and neglect, since some bicycle riders do not use their vehicles during winter. Bicycles are a mature vehicle technology, so their maintenance is well understood; e-bikes are reaching a level of maturity whereby this is also the case.
5.2. Small devices and powered micromobility #
Only in the last decade have batteries and motors had sufficient capability to make these vehicles feasible and desirable to the mass market, and as such, the maintenance of powered micromobility devices is still an emerging field. Vehicle retailers are a dependable source of maintenance and spare parts, however many users are unfamiliar with these because they purchased their vehicles online. As electronic devices, they may be more complex than bicycles, and as such subject to more points of maintenance and failure. As an emerging technology, the requirements for maintenance and roadworthiness are not fully resolved or keeping pace with vehicle developments.
5.3. Two and three wheeled motor vehicles #
Powered two-wheelers depend on their tyres for lateral traction and stability during cornering. Regular inspections for adequate tread depth and proper inflation are essential for maintaining traction. Worn tyres should be replaced, and many tyres feature tread wear indicators to signal when replacement is necessary. While powered three-wheelers are less reliant on tyres for stability, they still have three contact patches with the road, making proper maintenance crucial.
Powered two-wheelers can be chain, belt, or shaft driven, whereas powered three-wheelers typically use chain or belt drives. Chains should be cleaned of debris and lubricated regularly to prevent premature wear and breakage, especially under load. Both chains and sprockets require regular inspection and timely replacement. Belt drives generally have lower maintenance needs; they should be inspected for wear, cleaned, and, if applicable, lubricated and tensioned, which may involve adjusting pulleys. Worn belts and pulleys should be replaced. Shaft drives require less maintenance than chain and belt drives but should still be inspected for wear, with fluid levels maintained and replaced according to manufacturer recommendations.
Conspicuity is vital for powered two- and three-wheelers, as they are often smaller than other vehicles on the road. Regular checks of headlights, brake lights, and turn indicators are necessary for safe operation.
Brake components, including pads, discs or drums, and lines, should be regularly inspected for proper function. For hydraulic brakes, fluid levels must be checked and replaced according to the manufacturer’s guidelines. Additionally, the accelerator cable on powered two- and three-wheelers without throttle-by-wire should be checked and lubricated regularly as per manufacturer recommendations.
5.4. Cars and derivatives #
Maintenance is the responsibility of vehicle owners and there are several systems that require upkeep to ensure safe functionality. On cars and derivatives these systems include brakes, wheels, tyres, signal lamps, the windscreen, windscreen wipers, the suspension, headlamps, fuel lines, exhaust, and steering.
The failure or poor performance of these systems can result in crashes or contribute to crashes. Although, research suggests that the proportion of crashes which result from vehicle faults is relatively low at around 2-3% (Vaughan, 1993; Keatsdale, 1999; van Schoor et al., 2001; Das et al., 2019). The most commonly reported fault (leading to a collision) was associated with defects to brakes and tyres (Das et al., 2019; van Schoor et al., 2001). However, it is also acknowledged that many vehicle faults are difficult (i.e., time-consuming) to identify and, as a result, go undetected. This suggests that the proportion of crashes resulting from poor maintenance may be higher than indicated in police-reported databases.
In an effort to reduce the occurrence of crashes resulting from vehicle faults, some jurisdictions implement mandatory vehicle inspection schemes. However, the evidence is mixed on whether these schemes reduce the prevalence of crashes (Keatsdale, 1999; Wolfe & O’Day, 1985), particularly as many assessment performance criteria are relatively weak. For example, brake testing minimum performance criteria in Australia and New Zealand were found to be passable even by vehicles with quite severe brake faults (Mackenzie et al., 2020).
5.5. Larger motor vehicles, trucks, buses, trams, truck combinations, trailers, and caravan combinations #
Heavy vehicles generally require the same maintenance as light vehicles. However, in recognition that heavy vehicles are typically driven longer distances (as well as the greater consequences in the event of a collision) they tend to be subject to more regulation and inspection compared with private, smaller vehicles such as cars.
It is normal for trucks and buses to be inspected for various safety systems on a daily basis, with other tests conducted weekly, monthly etc.
6. Conclusion and Summary #
This chapter aims to present the reader with a foundational understanding of the role vehicles play in road safety. While the concept of a vehicle may be fairly simple, when delving into the details we can see that the myriad variations and types of vehicles means that there is no neat definition for all types. The vehicle fleet varies, and the make-up of a fleet in any particular place is a result of prevailing culture, economics and regulation to name just three. While vehicles ease transport of people and goods, they also do so to varying extents and at widely varying costs to society and the user. Vehicles vary as do roads, and even road rules and licensing. People use vehicles for a wide array of purposes; wherever and for whatever purpose, the road safety practitioner will do well to bear this variation in mind.
To improve safety, there is a range of designs and systems that can be employed to reduce the likelihood of injury in the inevitable occurrence of a collision. Some of these design features and safety systems are mandated through vehicle design standards, while others are encouraged through safety rating assessment programs. Beyond manufacture, it is important that vehicles are maintained properly to ensure all features and systems are operating optimally.
7. References #
Australian Competition and Consumer Commission. (2026). Bicycles mandatory standard. https://www.productsafety.gov.au/business/search-mandatory-standards/bicycles-mandatory-standard.
Allam, Z., Nieuwenhuijsen, M. & Allam, Z. (2024). Paris’s parking policy for healthier cities. The Lancet Planetary Health, 8(6), e343-e344.
ANCAP. (2021). ANCAP’s submission to the Joint Select Committee on Road Safety Inquiry [Submission]. Joint Committee on Road Safety. https://cdn.ancap.com.au/app/public/assets/c795cc9feb2a00f10e2fbfae0b8f7c2f7a2e1663/original.pdf?1634173431
ANCAP. (2023, November 23). ANCAP and Euro NCAP renew close ties with signing of MOU [Media Release]. https://www.ancap.com.au/media-and-gallery/media-releases/024c24.
ANCAP. (2024). ANCAP test protocol: Mobile Progressive Deformable Barrier (MPDB) (v1.1.4) [Protocol]. https://s3.amazonaws.com/cdn.ancap.com.au/app/public/assets/63b7311fbfe03c5990aee3bf1a0a89618e7bc65b/original.pdf?1714100373
ANCAP. (2026). Car safety testing: How are vehicles tested for safety?. https://www.ancap.com.au/how-are-vehicles-tested-for-safety
Ballester, O. C., Llari, M., Afquir, S., Martin, J. L., Bourdet, N., Honoré, V., Masson, C. & Arnoux, P. J. (2019). Analysis of trunk impact conditions in motorcycle road accidents based on epidemiological, accidentological data and multibody simulations. Accident Analysis Prevention 127, 223-230. https://www.sciencedirect.com/science/article/abs/pii/S0001457518308017
Boniface, G. & Horn, S. (2016). The critical role of data, education and enforcement in road safety. Journal of Road Safety, 27(3), 43–47. https://journalofroadsafety.org/article/32048-the-critical-role-of-data-education-and-enforcement-in-road-safety
Brown C. V., Hejl K., Bui E., Tips G. & Coopwood B. (2009). Risk factors for riding and crashing a motorcycle unhelmeted. Journal of Emergency Medicine, 41(4), 441-46. https://www.sciencedirect.com/science/article/abs/pii/S0736467909006519
Brown V., Peel O. & Jackson E. (2025). Austroads’ Review of Movement and Place Guidance (Report No. AP-R739-25). Austroads. https://austroads.gov.au/publications/network/ap-r739-25
Budd, L., Allen, T. & Newstead, S. (2018). Current Trends in Motorcycle Related Crash and Injury Risk in Australia by Motorcycle Type and Attributes (Report No. 336). Monash University Accident Research Centre. https://researchmgt.monash.edu/ws/portalfiles/portal/311141998/309908576_oa.pdf
Bureau of Infrastructure and Transport Research Economics. (2025). Road Vehicles Australia January 2025. https://www.bitre.gov.au/sites/default/files/documents/BITRE-Road-vehicles-Australia-January-2025.pdf
Casey, G. J., Miles-Johnson, T. & Stevens, G. J. (2024). Heavy vehicle driver fatigue: Observing work and rest behaviours of truck drivers in Australia. Transportation Research Part F: Traffic Psychology and Behaviour, 104, 136-153. https://www.sciencedirect.com/science/article/pii/S1369847824001153?via%3Dihub
Cicchino, J. B. (2017). Effectiveness of forward collision warning and autonomous emergency braking systems in reducing front-to-rear crash rates. Accident Analysis & Prevention, 99, 142-152. https://www.sciencedirect.com/science/article/abs/pii/S0001457516304006
Cicchino, J. B. (2022). Effects of automatic emergency braking systems on pedestrian crash risk. Accident analysis & prevention, 172, 106686. https://www.sciencedirect.com/science/article/abs/pii/S0001457522001221
CLOCS. (2025). Construction Logistics and Community Safety. https://clocs.org.uk.
CLOCS-A. (2025). Construction Logistics and Community Safety – Australia. https://clocs-a.org.au.
Constantinou,E., Panayiotou, G., Konstantinou, N., Loutsiou-Ladd, A. & Kapardis, A. (2011). Risky and aggressive driving in young adults: Personality matters. Accident Analysis & Prevention, 43(4), 1323-1331. https://doi.org/10.1016/j.aap.2011.02.002.
Das, S., Dutta, A. & Geedipally, S. R. (2019). Applying Bayesian data mining to measure the effect of vehicular defects on crash severity. Journal of Transportation Safety & Security, 13(6), 605-621.
DeHaven, H. (1969). Beginnings of crash injury research. In K. M. Brinkhous (Ed.), Proceedings of the International Conference on Accident Pathology (Publication No. FH-1) (pp. 1-6595). University of California, Chapel Hill.
Department of Infrastructure, Transport, Regional Development and Local Government. (2009). Regulation impact statement for underrun protection. Australian Government.
Euro NCAP. (2022). Euro NCAP vision 2030: A safer future for mobility. https://www.euroncap.com/press-media/euro-ncap-vision-2030-a-safer-future-for-mobility/
Euro NCAP. (2025). How to read the stars: The stars explained. https://www.euroncap.com/en/about-euro-ncap/how-to-read-the-stars.
European Commission. (2025). New rules to improve road safety and enable fully driverless vehicles in the EU. https://ec.europa.eu/commission/presscorner/detail/en/ip_22_4312.
European Climate, Infrastructure and Environment Executive Agency. (2022). EU Road Safety: Towards “Vision Zero”. https://cinea.ec.europa.eu/publications/digital-publications/eu-road-safety-towards-vision-zero_en.
Fietserbond. (2026). Mandatory bicycle helmet? The Cyclists’ Union says no. https://www.fietsersbond.nl/helmplicht/#:~:text=De%20Fietsersbond%20heeft%20gerede%20twijfel,kopen%20de%20helm%20tenslotte%20zelf.
Fildes, B., Newstead, S., Rizzi, M., Fitzharris, M. & Budd, L. (2015). Evaluation of the effectiveness of anti-lock braking systems on motorcycle safety in Australia (Report No. 327). Monash University Accident Research Centre. https://media.nrspp.org.au/wp-content/uploads/2024/10/06001604/muarc327.pdf
Fitzharris, M., Cockfield, S., Truong, J., Nieuwesteeg, M., Thompson, J. & Newstead, S. (2011). Effectiveness and estimation of likely benefits of side impact airbags in passenger vehicles in Victoria. Monash University Accident Research Centre.
Garrard, J. (2017). Young people and walking. Victoria Walks. https://www.victoriawalks.org.au/Assets/Files/Final_report_young_people.pdf
Garrard, J. (2023). Senior Victorians and walking: Obstacles and opportunities. Victoria Walks. https://www.victoriawalks.org.au/Assets/Files/FINALSeniorsFullReport.pdf
Global NCAP. (2025). NCAPs – Global NCAP. https://www.globalncap.org/ncaps.
Grzebieta, R. H., Jama, H., Bambach, M. R., Friswell, R. & Favand, J. (2010). Motorcycle crashes into roadside barriers. Stage 1: crash characteristics and causal factors [Research Report]. NSW Injury Risk Management Research Centre, UNSW. https://www.unsw.edu.au/content/dam/pdfs/science/aviation/research-reports/2022-02-research/2022-01-Motorcycle-into-Barrier-Stage1_report.pdf
Håland, Y. (2006, September). The evolution of the three point seat belt from yesterday to tomorrow. In Proceedings of International Research Council on the Biomechanics of Injury Conference (pp. 3-15). Chalmers University of Technology. https://www.ircobi.org/wordpress/downloads/irc0111/2006/BertilAldmanLecture/01.pdf
Hanrahan, R. B., Layde, P. M., Zhu, S., Guse, C. E. & Hargarten, S. W. (2009). The association of driver age with traffic injury severity in Wisconsin. Traffic injury prevention, 10(4), 361-367.
Haworth, N., Schramm, A., & Twisk, D. (2021). Comparing the risky behaviours of shared and private e-scooter and bicycle riders in downtown Brisbane, Australia. Accident Analysis & Prevention, 152, 105981. https://www.sciencedirect.com/science/article/abs/pii/S0001457521000129
Herlihy, D.V. (2004). Bicycle: the history. Yale University Press.
Hershman, L. L. (2001). The US new car assessment program (NCAP): Past, present and future (Technical Paper No. 2001-06-0245). SAE International.
Herslund, M. B., & Jørgensen, N. O. (2003). Looked-but-failed-to-see-errors in traffic. Accident Analysis & Prevention, 35(6), 885-891.
Heudorfer, B., & Kraft, M. (2009). Protection System for Far-Side Occupants in Lateral Crashes. Chest, 85, 35.
Høye, A. (2010). Are airbags a dangerous safety measure? A meta-analysis of the effects of frontal airbags on driver fatalities. Accident analysis & prevention, 42(6), 2030-2040. https://www.sciencedirect.com/science/article/abs/pii/S0001457510001788
Høye A. (2018). Recommend or mandate? A systematic review and meta-analysis of the effects of mandatory bicycle helmet legislation. Accident analysis and prevention, 120, 239–249. https://doi.org/10.1016/j.aap.2018.08.001
Hu, X. & Feng, Z. (2021). Advanced high-strength steel-basics and applications in the automotive industry (Report No. ORNL/TM-2021/2047). Oak Ridge National Laboratory. https://info.ornl.gov/sites/publications/Files/Pub158668.pdf
Insurance Institute for Highway Safety. (2025). Who we are. https://www.iihs.org/about
John Hopkins Medicine. (2026). Osteoporosis: What you need to know as you age. https://www.hopkinsmedicine.org/health/conditions-and-diseases/osteoporosis/osteoporosis-what-you-need-to-know-as-you-age
Keatsdale. (1999). Cost effectiveness of periodic motor vehicle inspection (Report No. 0416-201498). Federal Office of Road Safety. https://www.infrastructure.gov.au/sites/default/files/migrated/roads/safety/publications/1999/pdf/vehicle_inspect.pdf
Kim, S. & Oviedo-Trespalacios, O. (2025). Disuse of advanced driver assistance systems (ADAS). Journal of Safety Research, 95, 180-188. https://www.sciencedirect.com/science/article/pii/S0022437525001355
Langley, J., Mullin, B., Jackson, R., & Norton, R. (2000). Motorcycle engine size and risk of moderate to fatal injury from a motorcycle crash. Accident analysis & prevention, 32(5), 659-663.
Larue, G. S., & Naweed, A. (2020). Understanding why drivers cross the line at activated railway crossings. Transportation research record, 2674(8), 1-11. https://doi.org/10.1177/0361198120912238
Lie, A., Tingvall, C., Krafft, M., & Kullgren, A. (2006). The effectiveness of electronic stability control (ESC) in reducing real life crashes and injuries. Traffic injury prevention, 7(1), 38-43.
McLean, A. J. (1996). Pedestrian friendly vehicle front structures: A review of the research literature (1996) (Report No. CR 166). Australian Government Publishing Service. https://www.infrastructure.gov.au/department/media/publications/cr-166-pedestrian-friendly-vehicle-front-structures-review-research-literature-1996
Mackenzie, J. R. R., Van Den Berg, A. L., & Elsegood, M. E. (2020). Brake testing: what faults can be found? An investigation of the ability of various brake testing methods to detect mechanical or hydraulic brake faults on light vehicles (Report No. CASR173). Adelaide University, Centre for Automotive Safety Research. https://casr.adelaide.edu.au/casrpubfile/2533/CASR173.pdf
Mattsson, M., & Summala, H. (2010). With power comes responsibility: motorcycle engine power and power-to-weight ratio in relation to accident risk. Traffic injury prevention, 11(1), 87-95.
Miggins, M., Lottenberg, L., Liu, H, Moldawer, L., Efron, P., & Ang, D. (2011) Mopeds and scooters: crash outcomes in a high traffic state. Journal of trauma injury, infection and critical care, 71(1), 217-22.
MotoCAP. (n.d.). About MotoCAP. https://www.motocap.com.au/about-motocap
Moradloo, N., Mahdinia, I., & Khattak, A. J. (2025). Nighttime safety of pedestrians: The role of pedestrian automatic emergency braking systems. Accident analysis & prevention, 219, 108110.
National Association of City Transportation Officials. (2026). Turning radius for trucks. https://nacto.org/wp-content/uploads/turning-radius_NC_4truck-1024×868.png
National Heavy Vehicle Regulator. (2025). Load Restraint Guide 2025. https://www.nhvr.gov.au/files/media/document/728/202506-1285-load-restraint-guide-2025.pdf
Newgard, C. D. (2008). Defining the “older” crash victim: The relationship between age and serious injury in motor vehicle crashes. Accident analysis & prevention, 40(4), 1498-1505.
Newman, P. G., & Kenworthy, J. R. (1989). Cities and automobile dependence: An international sourcebook. Gower Publishing. https://search.worldcat.org/title/20132931
Newman, P. W., & Kenworthy, J. R. (1991). Transport and urban form in thirty‐two of the world’s principal cities. Transport reviews, 11(3), 249-272.
Newstead, S., Watson, L., & Budd, L. (2023). The Potential Benefits of Lane Keep Assist Systems in Australian Light Vehicles (Report No. 365). Monash University Accident Research Centre. https://www.monash.edu/__data/assets/pdf_file/0009/3219570/The-Potential-Benefits-of-LKAS-in-Australia-MUARC-Report-365.pdf
National Highway Traffic Safety Administration. (2025). Occupant crash protection (Standard No. § 571.208). https://www.ecfr.gov/current/title-49/subtitle-B/chapter-V/part-571/subpart-B/section-571.208.
National Highway Traffic Safety Administration. (2026). THOR 5th Percentile Female – Advancing Safety for Small Female Occupants [Factsheet]. https://static.nhtsa.gov/nhtsa/downloads/THOR-05F/Handouts/THOR-5TH-_Overview.pdf
Niebuhr, T., Junge, M., & Rosen, E. (2016). Pedestrian injury risk and the effect of age. Accident analysis & prevention, 86, 121-128.
Nishimoto, T., Kubota, K., & Ponte, G. (2019). A pedestrian serious injury risk prediction method based on posted speed limit. Accident analysis & prevention, 129, 84-93.
National Transport Commission. (2025). Our consultation on automated vehicle safety. https://www.ntc.gov.au/transport-reform/ntc-projects/av-safety-reform.
National Transport Safety Board. (2025). Automobile safety rating system is failing consumers. https://www.ntsb.gov/news/press-releases/Pages/NR20220603.aspx
Organisation for Economic Co-operation and Development/ECMT. (2006). Speed management. OECD Publishing. https://www.oecd.org/en/publications/speed-management_9789282103784-en.html
Oldenziel, R., Emanuel, M., de la Bruhèze, A. A. A., & Veraart, F. (2016). Cycling cities: The European experience: Hundred years of policy and practice. Foundation of the History of Technology and LMU Rachel Carson Center.
Pai, C., Lin, H., Tsai, S., & Chen P. (2018). Comparison of traffic-injury related hospitalisation between bicyclists and motorcyclists in Taiwan. PLoS One. https://doi.org/10.1371/journal.pone.0191221
Perticone, A., Barbani, D. & Baldanzini, N. (2023). Enhancing rider safety through Personal Protective Equipment: Investigating the influence of Powered Two-Wheeler styles on the performance of the Belted Safety Jacket. Traffic injury prevention, 33, 101614. https://www.sciencedirect.com/science/article/pii/S2590198225002933
Reid, C. (2015). Roads were not built for cars: How cyclists were the first to push for good roads & became the pioneers of motoring. Island Press.
Rizzi, M., Strandroth, J., Kullgren, A., Tingvall, C., & Fildes, B. (2015). Effectiveness of motorcycle antilock braking systems (ABS) in reducing crashes, the first cross-national study. Traffic injury prevention, 16(2), 177-183.
Rossheim M. E, Wilson F., Suzuki S., Rodriguez M., Walters S., & Thombs D. L. (2014) Associations between drug use and motorcycle helmet use in fatal crashes. Traffic injury prevention 15(7), 678-84.
Royal Osteoporosis Society. (2026). Age and Bone Strength. https://theros.org.uk/information-and-support/osteoporosis/causes/age-and-bone-strength/
Rumar, K. (1990). The basic driver error: late detection. Ergonomics, 33(10-11), 1281-1290.
Shaw, G., Crandall, J. & Butcher, J. (2000, September). Biofidelity evaluation of the THOR advanced frontal crash test dummy. In Proceedings of International Research Council on the Biomechanics of Injury Conference (pp. 11-29). University of Virginia. https://www.ircobi.org/wordpress/downloads/irc2000/pdf_files/2000_2.pdf
Sobhani, A., Young, W., Logan, D. & Bahrololoom, S. (2011). A kinetic energy model of two-vehicle crash injury severity. Accident analysis & prevention, 43(3), 741-754.
Strandroth, J. (2025). Human impact: What in-depth analysis of crashes tell us [Presentation]. Asia Pacific Road Safety Observatory. https://aprso.org/sites/default/files/2025-03/Strandroth%20Inc.%20-%20Human%20Impact_%20What%20In-Depth%20Analysis%20of%20Crashes%20Tells%20Us%20-%20Dr.%20Johan%20Strandroth%20%28undated%29.pdf
Transport for NSW. (2023). Be Truck Aware [Factsheet] (Stock Code 45072107). https://www.transport.nsw.gov.au/system/files/media/documents/2023/crs_be_truck_aware.pdf
Transportstylrelsen (2013). Ökad säkerhet på motorcykel och moped (v. 3). https://trafikverket.diva-portal.org/smash/get/diva2:1363778/FULLTEXT01.pdf
United Nations Economic Commission for Europe. (2017). Consolidated Resolution on the Construction of Vehicles (R.E.3) – Revision 6. https://unece.org/transport/vehicle-regulations/classification-and-definition-vehicles
United Nations Economic Commission for Europe. (2025). UNECE World Forum for Harmonization of Vehicle Regulations (WP. 29). https://unece.org/wp29-introduction.
van Schoor, O., van Niekerk, J. L. & Grobbelaar, B. (2001). Mechanical failures as a contributing cause to motor vehicle accidents: South Africa. Accident analysis & prevention, 33, 713–721.
Vaughan, R. (1993, March 23-24). Safety Maintenance of Road Vehicles. In Proceedings of the Institution of Mechanical Engineers, Braking of Road Vehicles (pp. 127-33). Institution of Mechanical Engineers, Birdcage Walk, London.
Viano, D. C. (2024). History of airbag safety benefits and risks. Traffic injury prevention, 25(3), 268-287.
VicRoads. (2016). Traffic Engineering Manual (v. 3): Guidance on bicycle and pedestrian treatments at roundabouts. https://www.the-terrier.com.au/wp-content/uploads/2019/02/TEM-Vol-3-Part-215-VicRoads-Guidance-on-Pedestrian-and-Cyclist-Treatments-at-Roundabouts.pdf
Victorian Government. (2025). Movement and Place in Victoria. https://www.vic.gov.au/movement-and-place-victoria.
Volvo. (2026). The three points that saved one million lives. https://www.volvogroup.com/en/about-us/heritage/three-point-safety-belt.html.
Wolfe, A., & O’Day, J. (1985). Cost-effectiveness of periodic motor vehicle inspection (PMVI): a review of the literature. The University of Michigan, Transportation Research Institute, for the National Highway Traffic Safety Administration, US Department of Transportation.
Woodrooffe, J. & Blower, D. (2015). Heavy truck crashworthiness: Injury mechanisms and countermeasures to improve occupant safety (Report No. DOT HS 812 061). National Highway Traffic Safety Administration. https://www.nhtsa.gov/sites/nhtsa.gov/files/812061_heavytruckinjurycountermeasures.pdf
World Health Organization. (2022). Powered two-and three-wheeler safety: a road safety manual for decision-makers and practitioners (2nd ed.). https://www.who.int/publications/i/item/9789240060562
World Health Organization. (2023). Global status report on road safety 2023. https://www.who.int/teams/social-determinants-of-health/safety-and-mobility/global-status-report-on-road-safety-2023
World Health Organization. (2025a). Promoting walking and cycling: a toolkit of policy options. https://www.who.int/publications/i/item/9789240109902
World Health Organization. (2025b). Streets for life: #LOVE30. https://cdn.who.int/media/docs/default-source/documents/health-topics/road-traffic-injuries/un-road-safety-week/streets-for-life-myths_and_facts.pdf?sfvrsn=907ecc78_3.
Wykes, N. J., Edwards, M. J. & Hobbs, C. A. (1998). Compatibility requirements for cars in frontal and side impact (Technical Paper No. 986059). SAE International.
Zioupos, P., Kirchner, H. O. & Peterlik, H. (2020). Ageing bone fractures: the case of a ductile to brittle transition that shifts with age. Bone, 131, 115176. https://dspace.lib.cranfield.ac.uk/server/api/core/bitstreams/a26a6b11-6f6d-4090-9ea5-11773f1bc2c5/content

