
Authors #
David McTiernan, Zero Transport Safety Advisory
Kenn Beer, Safe Systems Solutions Pty Ltd
Dr Shane Turner, Abley
Reviewers #
Professor Amelia Thorpe, University of New South Wales
Johann Tay, Traffic Vehicles & Logistics Pty Ltd.
Mohd Kairul Alhapiz Ibrahim, Road User Behavioral Change Research Center, Malaysian Institute of Road Safety Research
Dr Ingrid Johnston, ACRS
Abstract #
Roads and streets are the foundation of the land transport system. They connect communities, shape how people live and move, and provide the physical environment in which all road users – drivers, motorcyclists, pedestrians, cyclists, and passengers on public transport – must interact. The safety of users in these environments is not incidental, rather, it is determined by the decisions made in planning, designing, operating, and maintaining roads and streets throughout their lifecycle.
Over the past four decades, the practice of managing road infrastructure has shifted from approaches focused primarily on maximising motor vehicle throughput and complying with engineering standards towards a Safe System philosophy that has, at its core, the principle that serious road trauma is preventable. Under this approach, roads and streets are designed and managed to minimise, and eliminate where possible, human error and protect all users from crash forces that exceed the body’s tolerance for injury. This chapter examines how decisions for road and street infrastructure, from network planning through to day-to-day operations, should influence both the likelihood and severity of crashes. It discusses considerations for high-income countries and in low- and middle-income country (LMIC) contexts, where the infrastructure challenge is often greatest and the consequences of inaction most severe.
1. Introduction #
Roads and streets are dynamic environments. They carry people and goods across short and long distances and serve as social and economic corridors; their form and function reflect the values and priorities of the communities they connect. For millennia, roads have shaped how societies come together; they have influenced where people live, how they work, and how they access opportunity.
Today, roads and streets carry an increasingly diverse mix of users and modes. Private cars, motorcycles, heavy freight vehicles, buses, taxis, light rail/trams share space with pedestrians, cyclists, and a growing range of micromobility devices such as e-bikes and e-scooters. The people using these environments are equally diverse in their age, experience, physical ability, and in their exposure to risk and willingness to take risk. Commuters driving to work, children walking to school, older adults crossing busy arterials, motorcycle riders on rural highways, freight drivers on long interstate hauls each depend on the quality of the built road environment for their safety.
The scale of road trauma globally makes infrastructure safety one of the most consequential public health challenges of our time. The World Health Organisation (WHO) Global status report on road safety 2023 estimates that approximately 1.19 million people are killed on the world’s roads each year, with tens of millions more seriously injured (WHO, 2023a). The burden falls disproportionately on vulnerable road users and on populations in low- and middle-income countries (LMICs), where road infrastructure is often less developed and resources for safety investment more constrained (WHO, 202a3).
This chapter examines the role that road and street infrastructure plays in shaping safety outcomes. It traces the evolution of infrastructure practice from the vehicle-centred engineering of the mid-20th century to the Safe System Approach, and other strategic systems-based approaches, adopted globally at the start of this century, and it explores how planning, design, operations, and maintenance decisions affect crash risk across the infrastructure lifecycle (Australasian College of Road Safety [ACRS], 2023a). The chapter also addresses the particular challenges of infrastructure safety in LMIC contexts, where globally the majority, over 90%, of road deaths occur (WHO, 2023a) and where the mix of road vehicles, dominated by powered two and three wheeler vehicles, and significant interactions occurring between mechanised modes of transport and pedestrian and other non-mechanical transport modes, adds a layer of complexity for road infrastructure planners, designers and managers.
2. The Safe System Approach: Foundations for Infrastructure Practice #
Understanding the Safe System Approach is essential for every road safety professional. It provides the conceptual foundation for why infrastructure is designed and managed the way it must be, and why traditional approaches have proven inadequate to prevent road trauma at scale.
One of the most instructive observations in road safety is that two crashes involving similar circumstances can produce vastly different outcomes –one resulting in a tragedy, a fatality or life-altering injury, another involving little or no physical injury. Far from being random, this variability of outcome is explainable, in part reflecting the degree to which vehicle technology provided a safety envelope for occupants, but critically, too, how the road environment either amplified or absorbed the forces acting on the people involved. Recognising this is central to the Safe System Approach.
This understanding shapes how road safety practitioners, particularly infrastructure planners, engineers, and managers, must direct their efforts to eliminate road trauma. The starting point is always crash prevention, designing and managing roads in ways that reduce the likelihood of crashes occurring in the first place. But the Safe System Approach also confronts an uncomfortable reality – that not every crash can be prevented. When a crash does occur, the system must be designed to ensure that the energy transferred to road users remains within survivable limits. Harm minimisation is not a concession or a fallback, it is an intentional, built-in principle of the Safe System approach.
It is here, in the design of a forgiving, human-centred road environment, that infrastructure plays its most vital role.
2.1. What is the Safe System? #
The Safe System Approach begins with an ethical premise – that road deaths and serious injuries are not inevitable; it identifies that serious road trauma results from a road transport system that was designed without adequate regard for human physical limitations, and that the road system should be designed in such a way as to prevent, as much as is reasonably possible, errors by the people who are using it, and ensure that if and when road user error does occur, it does not result in death or catastrophic injury.
Central to this approach is an understanding of human biomechanical tolerance to crash forces. Research has established that the human body can withstand only limited levels of kinetic energy before sustaining fatal or life-changing injury. Although absolute thresholds cannot be set, Wramborg (2005) framed what has been widely accepted as ‘Safe System Speeds’, linking collision speed to the risk of fatal injury occurring. For instance, at impact speeds above approximately 30 km/h, the risk of a pedestrian being killed in a collision with a vehicle rises sharply; side-impact collisions at intersections are frequently fatal above 50 km/h; head-on vehicle crashes become highly lethal above 70 km/h (for further reading on this see Wramborg, 2005; Jurewicz et al., 2016). These thresholds are not administrative preferences but rather define the speed limits and design standards that a Safe System demands if serious road trauma is to be eliminated (Global Road Safety Facility [GRSF], 2023).
Infrastructure primarily focuses on the safety performance of roads and streets and particularly how their design influences safe speeds (GRSF, 2023). However, infrastructure also influences the safety of vehicles, the behaviour of road users, and how post-crash care might happen within the road transport system. Good road designs that manage speeds simultaneously reduce the consequences of vehicle failure and human error. No single element can compensate entirely for failure in another; all system elements must work together with each providing a layer of protection that reduces the overall risk of death and serious injury.
2.2. The Shift from Traditional Practice #
The road infrastructure design dominant through much of the twentieth century focused on vehicle throughput, on geometric compliance with standards, and on network efficiency (WHO, 2017). Safety was largely assumed to follow from ‘correct design’ – if a road met the ‘standard’, then it was considered safe. This approach produced significant improvements in mobility but had the apparent implication of embedding road trauma as an ‘accepted’ cost of movement.
Experience and research have demonstrated the limitations of this model. Standards developed for the efficient movement of vehicular traffic do not protect the most vulnerable users. Designs that prioritise vehicle speed over human tolerance create environments where errors are lethal. Crash data gathered over decades reveals predictable patterns of trauma that standards-based design has failed to prevent.
The Safe System Approach requires a different starting point for the management of roads and streets. Rather than asking “does this design meet the standard?”, road professionals need to ask, “does this design protect road users from fatal or serious injury if something goes wrong?”. This outcome-focused orientation requires designers to consider human limitations in absorbing information about the road ahead, about the variability in acceptance of risk, and our tolerance to crash forces as binding constraints on design, not as secondary considerations.
The transition from this traditional approach to a system-based approach is neither simple nor complete (GRSF, 2022a; WHO, 2017). Standards and guidelines are evolving, and many jurisdictions are at different points on the journey. The US Federal Highway Administration’s (FHWA) Safe System Roadway Design Hierarchy (Hopwood et al., 2024) and the International Transport Forum (ITF)/OECD Safe System Tool (2026) provide structured frameworks for evaluating how well current practice aligns with Safe System objectives.
2.3. Infrastructure Within the Safe System #
Roads and streets are both the most visible and the most enduring element of the land transport system. Unlike vehicles, which are replaced over years, or road user behaviour, which can shift in response to campaigns or enforcement, road infrastructure shapes behaviour over decades. A road built today will influence how people move, and how safely, for the life of that asset.
This longevity makes infrastructure decisions consequential in a way that other interventions are not. A poorly designed intersection, a missing barrier on a high-speed curve, or a footpath that forces pedestrians onto a carriageway will generate crashes until the infrastructure is changed in some way. Conversely, well-designed roads and streets create a self-reinforcing environment – roads that look and feel consistent with the sign-posted speed limit, intersections that reduce the number of conflict points, and roadsides that are forgiving can significantly reduce both the frequency and severity of crashes without requiring some form of ongoing intervention (WHO, 2023a).
To take Australia and New Zealand as an example, the Austroads Guide to Road Safety – Part 1 provides a comprehensive framework for understanding how infrastructure contributes to safer outcomes (Austroads, 2021a). The PIARC Road Safety Manual extends these principles across diverse international contexts, including LMIC settings (PIARC, n.d.).
3. Planning for Safe Roads and Streets #
Safety on a road network is determined before a single metre of pavement is laid. Decisions made at the planning stage about where roads go, how they connect, what role they serve in the network, and how they relate to the surrounding land use each establish the safety conditions that both design and operations must then work within. Planning well, considering the range of road users and road uses, is perhaps the most cost-effective way to build safety into the system.
3.1. The Road Hierarchy and Its Limitations #
Traditional road planning is organised around a functional hierarchy, with arterial roads serving high-volume, longer-distance movements, collector roads gathering traffic from local streets, and local streets providing access to individual properties. Road function typically determines design form, that is, the number of lanes, the speed limit, access arrangements, and the provision (or not) of facilities for different users.
This model was primarily focused on the vehicle. Safety was assumed to result from assigning the correct function and design to each road type. In practice, however, the functional hierarchy often failed to accommodate the needs of non-motorised road users – pedestrians and cyclists, and it did not adequately address the safety implications of roads serving multiple functions simultaneously – as most urban roads do. A road classified as a high-speed (≥80 km/h) arterial that also fronts schools, shops, and bus stops is inherently conflicted, and traditional hierarchy-based design cannot adequately resolve the conflict. Added to this is the non-static roadside environment; urban development and re-development of land-uses along road corridors can, in effect, change the function of the road; a lack of change in the form of the road will further create conflict and compromise safety for road users. Such impact from urban growth and redevelopment is especially a pressure that exists in LMICs where population and economic growth often results in once low traffic roads needing to carry higher volumes and a greater mix of light and heavy vehicles, interacting with powered two and three wheeler, pedestrian and non-motorised traffic.
3.2. Movement and Place: A More Integrated Framework #
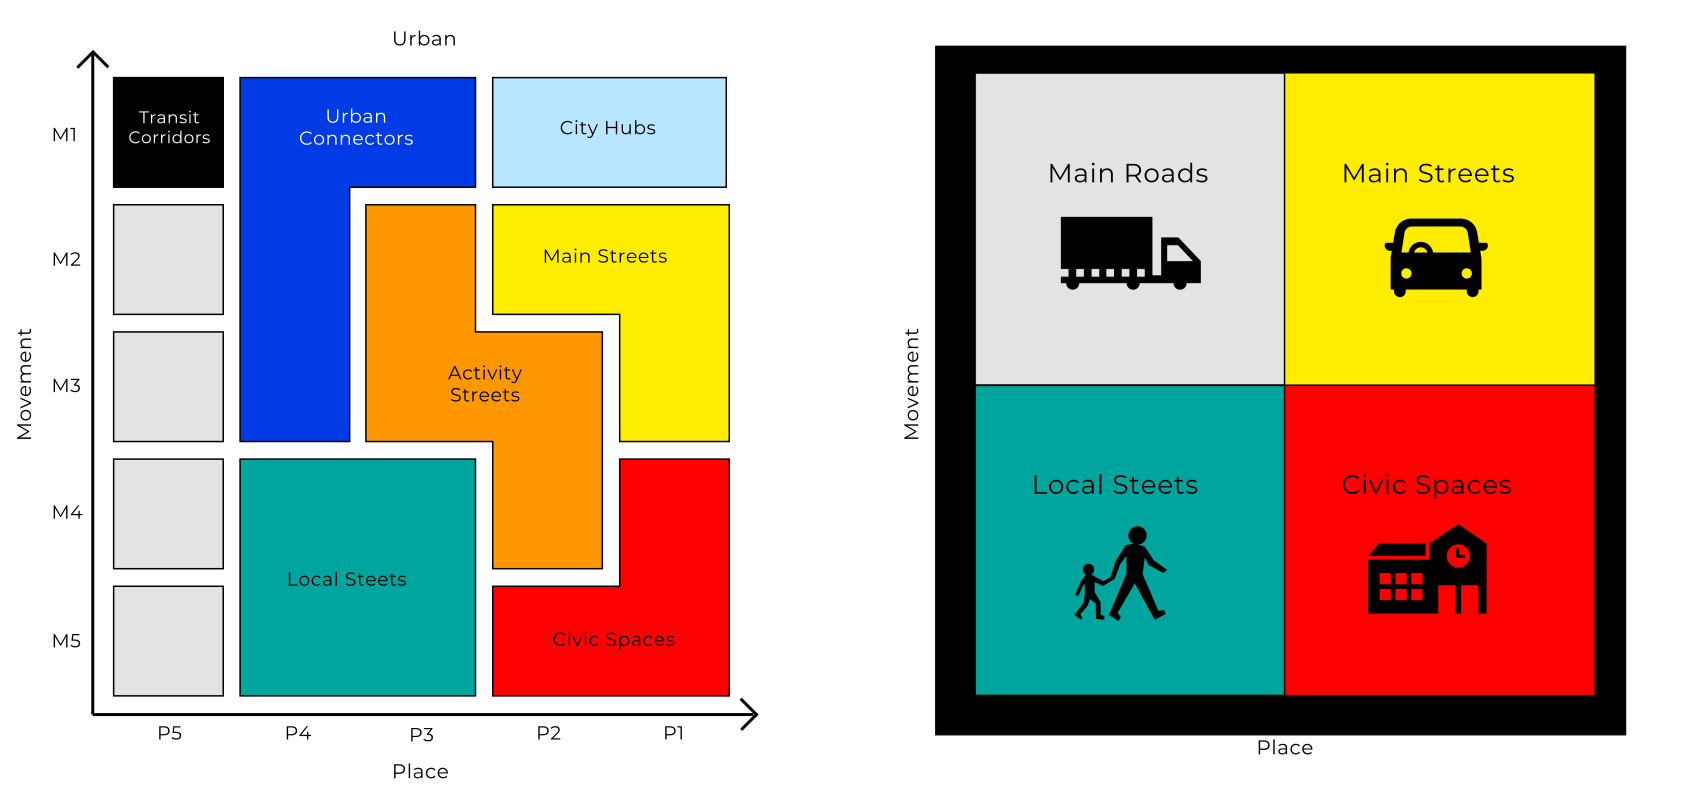
Contemporary road planning increasingly uses Movement and Place frameworks – sometimes called Link and Place or One Network Frameworks – to more holistically capture the dual function of roads as both movement corridors and places where people live, work, and gather. Under these frameworks, roads are classified not only by the volume and speed of traffic they are planned to carry, but by the place function they are intended to serve and the degree to which they are journey origins and destinations as well as routes (Brown et al. 2025).
This shift in road defining frameworks has direct safety implications for road users. For instance, a road with high place value, such as a main street with active frontages, pedestrian activity, and public transport stops should be designed with lower operating speeds in mind, separation between modes, and more attention to pedestrian amenity, regardless of its traffic volume. The movement and place lens helps planners and designers recognise when a road’s design form is misaligned with its actual function and provides a basis for resolving that misalignment in favour of safety.
The Australian Transport for NSW Movement and Place Framework and the New Zealand Transport Agency’s One Network Framework (NZTA, 2025b) are leading examples of how this approach has been institutionalised in practice (Brown et al., 2025). Internationally, the Global Street Design Guide (2016) and the NACTO Urban Street Design Guide (2026) provide people-centred design principles for urban environments developed from experience across dozens of cities worldwide.
3.3. Network-Level Safety Planning #
Beyond individual roads, network-level planning decisions shape patterns of exposure to crash risk. How a road network is configured determines where traffic concentrates, what speeds are plausible, and which users are forced into conflict with one another. Networks that provide genuine and accessible alternatives for walking, cycling, and public transport help reduce motor vehicle volumes on busy arterials, lower operating speeds, and create conditions where different modes are less likely to interact dangerously (WHO, 2023a).
Effective network-level safety planning integrates transport and land use planning to reduce unnecessary vehicle travel, locate high-pedestrian-activity destinations near lower-speed streets, and ensure that investment in infrastructure reaches the locations of greatest crash risk (Global Designing Cities Initiative, 2016). This requires road safety professionals to work alongside urban planners, public health practitioners, and community stakeholders, not only within the technical and engineering disciplines more typically leading road infrastructure projects.
The relationship between network management and safety is well addressed in the Austroads Guide to Traffic Management Part 1 (2020), which emphasises that traffic management must be integrated into a broader systems approach, with practitioners working across disciplines to achieve safer outcomes.
3.4. Planning in LMIC Contexts #
In LMICs, road network planning faces distinctive challenges. Rapid urbanisation, informal settlements, limited institutional capacity, and constrained budgets all create environments where basic infrastructure such as footpaths, safe pedestrian crossing points, streetlighting, etc. may be poorly available or altogether absent. At the same time, the mix of road users is often more complex, with powered two- and three-wheelers, animal-drawn vehicles, and pedestrians all sharing limited space with fast-moving cars and trucks on roads (WHO, 2023a).
The Safe System Approach and its frameworks for identifying effective measures to address road trauma provide a valuable reference for road infrastructure planners and designers. However, it should be acknowledged that effective planning of road infrastructure in LMIC settings often face resource constraints and local context sensitivities, which may limit a more holistic embrace of Safe System implementation. It may therefore be appropriate to consider phased or incremental approaches to infrastructure improvements. This may consider prioritising basic separation of vulnerable road users from high-speed traffic, investing in the highest-risk corridors first, targeting particular road user groups with simple, low-cost treatments that can be rapidly deployed at scale (WHO, 2017). The relative affordability of powered two-wheeler vehicles sees this mode of transport often dominate the mix of traffic across many LMICs, but infrastructure planning and design processes may lack the clear guidance of a prioritisation framework to guide road practitioners on effective measures to address known road infrastructure hazards. Globally supported tools such as iRAP ([International Road Assessment Programme], discussed further in Section 6) help identify where investment in road infrastructure will have the greatest impact, even in data-scarce environments. The Global Road Safety Facility (GRSF) and the World Bank also provide guidance specifically tailored to planning for safety in these contexts and have tools to help practitioners identify affordable and effective infrastructure-based safety improvement measures.
4. Designing Safer Roads and Streets #
Road design translates planning intent into physical form. The geometry of a road, the treatment of its intersections, the provision for different types of road users, and the management of the roadside environment all directly shape the degree of crash risk that road users face (WHO, 2017). Safe design requires moving beyond compliance with minimum standards to a dual outcome-focused approach that asks whether the design minimises the potential for road user error and will it protect life when something goes wrong.
4.1. Human Factors in Road Design #
Roads that produce crashes often do so because their design exceeds, or fails to support, the perceptual and cognitive capabilities of road users, contributing to poor or mistimed decision-making. Drivers and riders rely on visual cues in the road environment to judge appropriate speed, anticipate and perceive the presence of hazards, and to safely navigate their journey. When those cues are absent, ambiguous, or misleading, error rates increase and the potential for road trauma exists.
Human factors considerations in road design include ensuring road geometry is consistent with the speed environment (so that curves, sight distances, and stopping distances are appropriate for the operating speed); providing clear and consistent delineation that guides road users through complex environments; designing intersections to reduce approach speeds and minimise the number and angle of conflict points; and ensuring that the overall road environment communicates the correct expectation of speed (GRSF, 2023). A road that looks like a high-speed highway but carries a 50 km/h limit will frequently be driven at higher speeds, not because drivers are reckless, but because the road itself signals a different behaviour. Commonly referred to as the self-explaining road (SER) concept, this approach to road design originated in the Netherlands and is increasingly being incorporated into road design guidance around the world (iRAP, 2022b).
4.2. Managing Road Safety Risk #
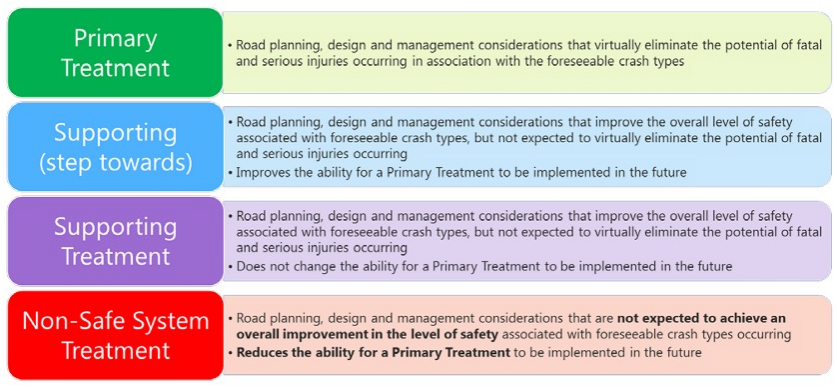
While the elimination of fatal and serious road injury is the ultimate objective of the Safe System Approach to road safety, a core component of achieving this across a road network is the management of road safety risk. Foundational to risk management is reducing the likelihood of an incident (i.e., a road crash) and/or reducing the severity of an incident (i.e., the degree of road trauma suffered by road users involved in a crash). With regard to road infrastructure, a hierarchy of Safe System effect can be applied to design measures such that ‘primary treatments’ virtually eliminate serious road trauma through likelihood and severity, while other treatments may be ‘supporting Safe System objectives.
4.2.1. Reducing the Likelihood of Crashes #
Safe design begins by reducing the conditions that lead to crashes in the first place. Key design elements that reduce crash likelihood include:
- Alignment and geometry: Roads should be designed so that curves, gradients, and transitions are consistent with operating speeds. Unexpected sharp curves on high-speed roads are a leading cause of run-off-road crashes.
- Intersection design: Intersections concentrate conflict between road users. Reducing the number of conflict points through the provision of roundabouts, grade separation, or turn restrictions, directly reduces crash likelihood. Well-designed roundabouts not only reduce the number of conflict points, but they also induce slower travel speeds through the intersection; this dual design feature of roundabouts can reduce serious casualty crashes by 60–80% compared with priority-controlled intersections (WHO, 2017).
- Access management: Uncontrolled access along busy roads from driveways, side roads, and unsignalised intersections increases the number of points of potential vehicle conflict. Consolidating access and separating turning movements reduces exposure to potential crashes.
- Separation of modes: Where vulnerable road users share space with motorised traffic, the risk of crashes is elevated. Dedicated infrastructure through separated cycleways, footpaths, grade-separated crossings, etc. reduces the frequency of conflict between incompatible modes (WHO, 2017).
- Speed management: As discussed earlier, road and street design to manage vehicle speed is effective in reducing road trauma; slower travel speeds provide increased opportunity for drivers to observe a potential conflict and stop or take evasive action to avoid a collision (GRSP, 2023).
As additional guidance, reducing crash likelihood requires infrastructure planners, designers, and managers to consider the needs of each road user group. This may include managing conflicting demands or may be influenced by the dominant user group on the network, or even on particular roads. The GRSF’s Guide to Integrating Safety into Road Design (Mitra et al. 2022) provides comprehensive guidance on embedding safety at every stage of the design process, with particular attention to LMIC settings.
4.2.2. Reducing the Severity of Crashes #
Even in well-designed environments, crashes may still occur. Safe design must therefore manage the energy transfer in a crash so that outcomes remain survivable. This is the “forgiving road” concept – an acknowledgement that the road environment has a responsibility to protect users even when they make mistakes (iRAP, 2022a).
Key design elements that reduce crash severity include:
- Speed management through design: Speed management is a dual acting element, not only reducing the likelihood of a crash (see above discussion) but also the severity of a crash. The design of a road should be consistent with, and actively support, the desired speed limit. Roads engineered for lower operating speeds, such as through lane widths, horizontal curvature, and traffic calming, produce lower actual speeds without relying on enforcement alone (GRSP, 2023).
- Median treatments: Centreline and median barriers prevent head-on crashes, which are among the most severe crash types. Wire rope safety barriers and concrete median barriers have both been shown to significantly reduce fatalities on high-speed roads through the prevention of vehicle-to-vehicle collision (likelihood) and a lowering of crash energies (severity).
- Roadside hazard management and clear zones: When vehicles leave the carriageway, the roadside environment determines whether they can recover safely or will collide with a fixed hazard. Clear zones are areas free of hazardous obstacles and can provide errant drivers the opportunity to correct their travel. A word of caution is required in the provision of clear zones (WHO, 2017). Research shows that while clear zones can provide safety benefits for a certain distance from the traffic lane, the safety benefit can diminish after several metres due to the increased potential for vehicles to rollover, causing fatal or serious injury to vehicle occupants. For this reason, where adequate clear zones cannot be provided, safety barriers or attenuators that absorb crash energy may be more effective in addressing crash severity than providing very wide clear zone areas.
- Safe intersection geometry: Intersection angle, approach speed, and sight distance all influence crash severity. T-intersections and roundabouts reduce the incidence of high-severity right-angle crashes. Raised intersections and plateaus reduce approach and through speeds and alert drivers to the conflict zone (WHO, 2017; GRSP 2023).
The Austroads’ compendium Towards Safe System Infrastructure (Woolley et al., 2018) synthesises international evidence on the effectiveness of a wide range of infrastructure interventions, providing practitioners with a practical evidence base for design decisions.
4.3. Infrastructure for Vulnerable Road Users #
Vulnerable road users – pedestrians, cyclists, motorcyclists, children, older adults, and people with disabilities – are disproportionately represented in road trauma statistics. Unlike vehicle occupants, they have no passive protection and are directly exposed to crash forces in a collision, a disparity that is particularly pronounced in low- and middle-income country (LMIC) road environments due to their much greater representation among road users in those settings. Designing safety into road infrastructure for vulnerable road users is therefore central to the Safe System Approach, not an optional enhancement.
Road safety professionals must consider the specific context of their road network when assessing and responding to the needs of vulnerable road users. Where applicable, the Movement and Place framework provides a valuable tool for matching road form to the dominant road user presence (Corben, 2020). In contexts where alternative frameworks apply, or where resource and funding constraints are a reality, efforts should be directed toward prioritising infrastructure measures most likely to deliver meaningful safety outcomes. In support of this, two principles warrant particular emphasis:
- Separation: providing dedicated infrastructure – footpaths, cycle lanes, and motorcycle lanes – that physically separates vulnerable road users from motorised traffic reduces both crash likelihood and severity. This is especially critical in LMIC environments where such infrastructure is frequently missing.
- Speed management: the relationship between vehicle speed and the severity of harm to vulnerable road users is well established. Reducing operating speeds through design, regulation, and enforcement is among the highest-impact interventions available and should be treated as a primary consideration, not as secondary ones.
4.3.1. Pedestrians #
Pedestrian safety depends on the provision of footpaths, safe crossing points, adequate lighting, and separation from fast-moving traffic. In urban areas, the most effective interventions include raised pedestrian crossings (which act to both slow vehicles and improve visibility of pedestrians to approaching drivers), pedestrian-only phases at signalised intersections, and the removal of high-speed turning movements near crossing points. Kerb extensions and median refuge islands can reduce crossing distances and time of exposure to through traffic (GRSP, 2023).
Key resources for pedestrian safety include Keeping People Safe When Walking (Austroads, 2025), which reviews global evidence on pedestrian risk and effective countermeasures, and the Aotearoa Urban Street Planning and Design Guide (NZTA, 2026) which provides a comprehensive framework for inclusive urban street design across diverse road contexts.
4.3.2. Cyclists and Micromobility Users #
Cyclists face elevated risk at intersections, where drivers in turning vehicles may fail to see them, and along road midblocks, where they share carriageway space with fast-moving traffic. The most effective infrastructure response is physical separation via dedicated cycleways separated from both the carriageway and pedestrian footpaths, where these provide the highest level of protection, not just for cyclists, but for pedestrians, too. Where separation is not possible, lower speed limits, high-visibility markings, and protected intersection designs reduce risk (WHO, 2020; de Rome et al. 2014; Boufous, 2018).
The growth of micromobility devices such as e-bikes and e-scooters creates new design challenges, as these modes accelerate and travel faster than traditional bicycles and are used by a broader range of people with varying ages and levels of skills. Infrastructure designed for conventional cycling needs to accommodate these higher speeds while maintaining separation from pedestrians.
4.3.3. Motorcyclists and Powered Two- and Three- Wheelers #
Motorcyclists are significantly over-represented in crash statistics relative to their share of vehicle kilometres travelled (ACRS, 2024; WHO, 2022). In urban environments, the most common fatal crash type involves a driver turning across the path of an oncoming motorcyclist in a “looked but failed to see” error driven by the relative infrequency of motorcycles in the traffic stream combined with a smaller visual profile and nimbleness of movement through traffic. In rural areas, run-off-road crashes on challenging alignments are a dominant pattern, this due to a combination of rider skill, overconfidence, lack of ride planning, and not least variable road conditions.
Infrastructure responses for motorcyclists include improving sight lines at intersections; providing rumble strips and audio-tactile delineation on rural roads with challenging curves; avoiding roadside hazards such as exposed barrier posts and end treatments; and trialling advanced stop lines and motorcycle-specific signals at intersections to permit riders to be positioned ahead of other traffic, increasing visual awareness and remaining clear of traffic (WHO, 2022). Wire rope barriers, while effective for cars, can present an elevated risk for motorcyclists; this is due to the exposed posts presenting a rigid object in the path of an errant rider and therefore careful consideration of treatment selection, placement and end treatment design is required.
In LMIC contexts, particularly across Southeast Asia, motorcycles or powered two- or three- wheelers, are a more affordable and more flexible mode of transport and therefore a dominant mode of travel. As a result, this mode of transport accounts for a majority of road deaths (WHO, 2022). Providing separated motorcycle lanes, trialling motorcycle boxes at signalised intersections, and managing speed at conflict points are among the interventions with the greatest potential impact in these settings (WHO, 2022). The following table provides an example of how the range of safety measures might be collated, assessed in context, and prioritised for consideration of action by lead actioners. This type of approach can assist decision makers in taking effective action in resource and funding constrained contexts.
| Domain | Suggested action | Note of discussion | Lead actioner |
| Critical — address first | |||
| Speed management | Align speed environments with human tolerance in mixed traffic. Implement self-explaining road design — markings, traffic calming, visual narrowing — so the road communicates the appropriate speed without relying on enforcement alone. | Riders sometimes choose higher speeds to reduce exposure time during overtaking; speed limits alone do not change this without supporting design. | Road authority (+ police) |
| Human factors / hazard perception | Design roads for visibility, predictability, and reduced ambiguity. Ensure geometry, signage, and delineation support correct hazard perception at operating speeds. | Overtaking behaviour reflects situational awareness and hazard perception, not just infrastructure form. Designs that assume perfect road users consistently fail. | Designers (+ training bodies) |
| Phased implementation | Sequence interventions realistically: address speed management and maintenance deficiencies before expanding infrastructure. Behavioural risk must be reduced before structural investment can be fully effective. | Jumping directly to infrastructure expansion without addressing behaviour-driven risk produces ineffective outcomes. | Transport ministry (all stakeholders) |
| High — implement as resources allow | |||
| Lane geometry (width) | Identify segments with lanes narrower than 3.0 m and prioritise widening or compensating speed reductions. | Narrow lanes force riders toward the road edge, reducing safety margins and increasing run-off-road risk. | Road authority (+ designers) |
| Roadside hazards and guardrails | Audit and redesign roadside elements in corridors with significant motorcycle use. Remove or relocate rigid hazards; assess guardrail placement and end treatments. | Guardrails can increase operating speeds through perceived safety (risk compensation), resulting in more severe crashes when collisions occur. | Road authority (+ safety engineers) |
| Lateral safety space | Define minimum lateral operating space standards for overtaking manoeuvres; incorporate into design briefs and audits. | Safe overtaking depends on relative rider positioning, not just lane width. Inadequate lateral space generates unsafe overtaking conflicts. | Designers (+ researchers) |
| Intersection design | Reduce decision complexity and conflict points at key intersections. Improve approach visibility, simplify geometry, and eliminate ambiguous priority arrangements. | Sudden evasive manoeuvres indicate risk misjudgement and perception failure. High cognitive load at intersections drives error rates. | Road authority (+ traffic police) |
| Overtaking risk management | Identify high-overtaking segments using data or field observation. Control geometry and speed at these locations; consider overtaking lane provision where volumes justify it. | Overtaking is a high-demand cognitive task. High-speed overtaking is associated with severe crash outcomes. | Road authority (+ researchers) |
| Surface condition | Establish rapid-response maintenance for potholes, debris, and surface irregularities on routes with significant motorcycle use. | Unexpected surface hazards cause trajectory adjustments that can place riders into conflict with other traffic. | Road agency (+ local government) |
| Conditional — where volumes and design standards justify | |||
| Exclusive motorcycle lanes | Pilot dedicated motorcycle lanes only in high-volume corridors and only with proper design standards and continuity. Do not deploy in isolation or without enforcement. | Exclusive lanes reduce crash rates but may introduce new risk types — speeding, run-off-road, and same-direction conflicts — if poorly designed or under-enforced. | Road authority (+ enforcement) |
| Enabling and strategic — foundational to all tiers | |||
| Data and micro-behaviour monitoring | Deploy video analytics or naturalistic data collection to capture operating speed, lateral position, and overtaking behaviour as leading safety indicators. | Micro-level behavioural indicators explain safety outcomes more precisely than crash counts alone; absence of this data leads to misdirected investment. | Government (+ research bodies) |
| Behavioural adaptation (risk compensation) | Incorporate behavioural modelling into design evaluation. Anticipate how riders will respond to new infrastructure and adjust designs to prevent risk compensation. | Riders adapt speed and position based on perceived, not actual, safety. Well-intentioned over-design can paradoxically increase risk-taking behaviour. | Researchers (+ road authority) |
4.3.4. Children and Older Adults #
Children and older adults have distinct perceptual and physical characteristics that affect their safety when navigating roads and streets. Children have limited ability to judge vehicle speed and gaps in traffic; they tend to make less predictable crossing decisions and are less visible to drivers (WHO, 2017; UNCF, 2022; Peden et al. 2008). Older adults may have reduced reaction times, hearing and vision impairments, and have greater physical vulnerability to crash forces compared to younger adults. Road designs must account for these characteristics, particularly around schools, healthcare facilities, and in residential areas with high concentrations of older residents, ensuring facilities are provided to cater for these age groups and their needs (Stearns et al. 2023).
4.4. Road Safety Audits and Inspections #
Road safety audits (RSAs) are a formal, independent examination of a road design that may be undertaken at any stage from planning through to post-opening of a road/traffic facility; the purpose of a RSA is to identify potential safety issues (hazards) before they result in crashes. Conducted by qualified auditors who are independent of the design team, RSAs apply a systematic safety lens to design decisions and provide recommendations for improvement, eliminating risk where possible, and mitigating them where not. RSAs are one of the most cost-effective road safety tools available to practitioners, consistently demonstrating high benefit-to-cost ratios by identifying and resolving issues early, even before they are built into the road and street environment.
Road safety inspections (RSIs) apply a similar process of review but to existing roads, identifying features of the operating network that contribute to crash risk, including road, signs and linemarking condition, poorly delineated curves, a lack of clarity in warning and directional signage, etc. Together, RSAs and RSIs are the primary proactive tools for identifying infrastructure safety problems and complement a reactive analysis of crash data that has historically dominated infrastructure safety management.
The Austroads (2022) Guide to Road Safety Part 6: Road Safety Audit provides the standard Australian and New Zealand framework for conducting RSAs and is an often referenced guide by practitioners internationally. The iRAP methodology extends network-level risk assessment to lower-resource settings where traditional RSA programmes may not be feasible.
4.5. Design for LMIC Contexts #
Design standards and guidelines developed for high-income countries provide useful reference material but must be applied carefully in LMIC settings since the physical, financial, and institutional contexts can differ substantially. Road design in many LMICs must address mixed-use environments where pedestrians, livestock, motorcycles, and trucks share unsealed roads without any formal separation; there is often an absence of footpaths and streetlighting that is standard in high-income country contexts; and infrastructure maintenance backlogs that mean new infrastructure deteriorates rapidly without adequate investment in ongoing upkeep (WHO, 2023a).
Context-appropriate design in LMIC settings often needs to prioritise high-impact, low-cost interventions; these typically include paved shoulders that remove pedestrians from the carriageway; rumble strips that alert drivers to intersections and curves; median barriers on high-speed undivided roads; and improved lighting at pedestrian crossing points (WHO, 2017). Physical separation of vulnerable road users from high-speed traffic should be a priority wherever resources allow.
5. Operating and Maintaining Safe Roads #
A road that is well designed can still produce crashes if it is poorly operated or inadequately maintained. The way a road is managed throughout its life, through speed limits and enforcement, traffic management systems, maintenance of pavement and roadside assets, and response to incidents, has a direct and ongoing influence on safety outcomes.
5.1. Speed Management #
As discussed previously, speed is arguably the single most important determinant of crash risk, influencing both likelihood and severity. For severity, alone, the kinetic energy that must be absorbed in a crash increases with the square of the speed; in effect, doubling a vehicle’s speed quadruples the energy involved (GRSP, 2023). Conversely, modest reductions in operating speed can produce significant reductions in fatal and serious injury crash rates by addressing likelihood and severity.
Effective speed management under a Safe System Approach means aligning speed limits with the crash-survivable threshold for the road environment, not with historical practice or community expectation (GRSF, 2026). On roads where pedestrians are present and unprotected, a 30 km/h speed limit reflects the biomechanical evidence for serious road trauma. On undivided rural roads without median barriers, operating speeds above 70 km/h create exponentially increased risk of fatal head-on crashes.
Speed management involves several interrelated elements; these include setting appropriate speed limits based on road function and user mix; designing roads so that the physical environment supports the speed limit (so that drivers naturally travel at safer speeds rather than relying on enforcement to attain compliance); applying traffic calming measures where existing roads carry traffic faster than is considered appropriate and safe; and enforcing limits through camera and police-based programs. The alignment between road design, speed limit, and operating speed is critical since a speed limit that is inconsistent with the visual character of a road will be routinely ignored by drivers (Williamson, 2021).
Key resources about speed and speed management include the GRSF’s Guide for Safe Speeds (2022), Austroads Guide to Road Safety Part 3: Safe Speeds (Hall et al., 2026), and the NZTA’s Speed Management Guide (2022).
5.2. Road Maintenance and Safety #
The condition of road infrastructure directly affects crash risk. Deteriorated pavements, failed line markings, illegible signs, inadequate drainage, and overgrown vegetation that obscures sight lines are all failures of maintenance, and all can have safety consequences. In high-income countries, maintenance programs are generally well established, though ageing asset bases and budget pressures mean that maintenance backlogs are common and may be driven more by asset preservation than enhancing safety. In LMIC settings, the maintenance deficit is often much more significant; new infrastructure can deteriorate to an unsafe condition within years if maintenance funding is not secured alongside capital investment.
From a system perspective, maintenance should be understood as a safety function, not merely an asset management activity. Maintenance programs should be prioritised based on safety risk, addressing the features most likely to contribute to crashes first. Key safety-critical maintenance activities include pavement resurfacing to restore skid resistance; line marking and sign replacement renewal to ensure good guidance to drivers; barrier inspection and repair; clearing roadside vegetation from signs and lines of sight, and maintenance of drainage infrastructure to prevent surface flooding (and ultimately accelerated pavement deterioration).
5.3 Intelligent Transport Systems and Real-Time Safety Management #
Perhaps not traditionally considered part of ‘road infrastructure’, intelligent transport systems (ITS) technologies are increasingly used to monitor and manage road safety in real time. Traffic signal systems, variable speed limits (VSL), lane use management systems (LUMS), and freeway ramp metering all provide tools for managing traffic flow and therefore aid to reduce crash risk in response to changing traffic and weather conditions.
Advanced traffic management systems (ATMS) use sensors – increasingly camera-based rather than pavement-embedded – to monitor traffic conditions and detect incidents. Coupled with video analytics, these systems can identify traffic conflicts and near-miss events, provide early warning of emerging crash risk and enable a faster response than waiting for crashes to be reported by the public. Post-crash, incident management systems have been developed that can alert emergency services, reduce medical response times, and improve crash scene management, all of which improve outcomes for crash victims.
ITS applications are also proving effective in specific high-risk environments; rural intersection activated warning signs (RIAWS) alert drivers on high-speed through-roads when vehicles are preparing to turn into or out of side roads. Variable message signs, including speed reductions, aid managing driver behaviour through roadworks, reducing error and protecting both vehicle occupants and roadworkers. An emerging technology is connected vehicles; these technologies hold promise for further real-time communication between road infrastructure environment and vehicles, providing advanced warning of changes in road conditions, providing drivers with time to respond and adapt accordingly (European Climate Infrastructure and Environment Executive Agency, 2022).
5.4. Monitoring, Evaluation, and Performance Management #
Effective safety management requires systematic monitoring of both infrastructure condition and safety outcomes. Without measurement, it is not possible to know whether interventions are working to reduce road trauma, where the highest-priority risks remain, or how to make the case for continued investment in safer road infrastructure.
Safety performance is monitored through two complementary approaches – outcome monitoring and surrogate safety monitoring. Outcome monitoring tracks actual crashes, their number, severity, location, and type, over defined periods of time. This provides the clearest evidence of what is working, but a limitation is that crash data is inherently retrospective and, particularly in LMIC settings, significantly under-report actual crashes. Surrogate safety monitoring considers lead indicators and use measures such as vehicle operating speeds, traffic conflicts, and near-miss events to assess safety performance before crashes occur. Surrogate measures are faster to obtain (than crash data), respond more quickly to changes in traffic and the road environment, and most notably do not require crashes to happen before problems can be identified.
Key performance indicators (KPIs) and safety performance indicators (SPIs) provide a structured framework for monitoring progress against road safety goals and objectives. Effective SPIs focus not only on final crash outcomes but on the intermediate conditions, for instance operating speeds, infrastructure standard, compliance rates etc., that determine those outcomes. The separation of leading indicators (which assist predicting future crashes) from lagging indicators (which reflect past performance) is important for a proactive safety management approach.
6. Data, Tools, and Evidence-Based Investment #
Investment in road safety infrastructure should be guided by evidence, i.e., where crashes are occurring, what are the contributing infrastructure factors, and which interventions will deliver the greatest reduction in road safety (infrastructure) risk. A growing suite of tools and data sources supports this evidence base, from traditional crash analysis to predictive risk modelling applicable even in data-scarce environments.
6.1. Crash Data and Its Limitations #
Crash data, compiled from records of crashes reported to police or collected by road agencies, has traditionally been the primary basis for identifying high-risk locations and prioritising infrastructure investment. Crash data is valuable for identifying persistent problem locations and understanding crash patterns by type, severity, and contributing factor (ACRS, 2023b).
However, crash data does have significant limitations (ACRS, 2023b). Under-reporting is pervasive with minor injury crashes routinely not reported, and even serious injury crashes may be inaccurately reported (time, location, road conditions, level of injury) or not reach official records (Harrison et al. 2023). In LMICs, crash reporting systems may be poorly functioning or inaccessible to road agencies (WHO, 2017; Wambulwa et al. 2019). Where crash counts are low, as they are on most individual road segments outside hotspots, then statistical analysis can be unreliable; and by its very nature crash data is reactive since it documents failures that have already occurred rather than predicting where the next crash will happen. In the past this was less an issue in determining investment priorities, since crashes were routinely observed to ‘cluster’ forming crash ‘black spots’ across the network; however, in nations where road safety investment programs that have been systematically delivered over long periods, patterns of crashes are increasingly observed to be randomly dispersed resulting in a change to funding eligibility criteria. This initially involved grouping crashes over a distance of 1 to 3 km, known as a ‘Black Length’; further success over time resulted in BCR requirements and the minimum number of qualifying FSIs being relaxed. The success of the Australian Federal Black Spot Program to reduce the number of reactive black spot/lengths has seen an increasing proportion of funding being made available to ‘proactive nominations’, drawing on road safety audits and risk-based network assessments, a move increasingly aligned with the Safe System Approach.
6.2. Predictive Risk Assessment #
Predictive crash risk methods address the limitations of crash data by modelling the inherent risk of road infrastructure based on its physical characteristics independently of whether crashes have been recorded, or not. The most widely applied method internationally is the International Road Assessment Programme (iRAP), with nationally branded versions such as AusRAP, KiwiRAP, ChinaRAP, usRAP and BrazilRAP, which assesses infrastructure risk based on a structured survey of road features (e.g., lane widths, presence and type of roadside hazards, intersection type, presence or absence of pedestrian and cycling infrastructure, etc.). The iRAP methodology produces star ratings for each 100 m road segment, from zero stars (most dangerous) to five stars (safest), and generates safer road investment plans (SRIPs) showing the crash reduction and the cost-effectiveness of infrastructure improvements. iRAP models are now applied in over 120 countries, including many with severe crash data limitations.
Other predictive risk model tools are available, for instance the Infrastructure Risk Rating (IRR) tool, which provides a simplified version of an infrastructure risk assessment using eleven key variables. IRR is particularly applicable where data collection resources may be constrained, and while IRR does not provide have the same breadth or depth of analysis as iRAP, road segment information can be entered easily to quickly build a route or network picture of road infrastructure safety risk.
Safety performance functions (SPFs), crash reduction factors (CRFs), and crash modification factors (CMFs) provide statistically derived estimates of expected crash frequency based on road characteristics, and the proportional crash reduction associated with specific treatments. These methods are more data-intensive but enable more precise prediction and economic appraisal of infrastructure risk and treatments. SPFs, CRFs, and CMFs are documented in the US Highway Safety Manual (FHWA, 2026) and New Zealand’s Crash Estimation Compendium (NZTA, 2025a); jurisdictions often collate SPFs, CRFs, and CMFs reflecting local experience with different road treatments and may reference these when developing their own road infrastructure investment programs.
6.3. Economic Appraisal of Safety Investment #
Making the case for safety investment has traditionally required demonstrating the economic value of crash reduction. Road crashes impose enormous costs on individuals, families, healthcare systems, and national economies, including direct costs (medical treatment, emergency response, vehicle damage) and indirect costs (lost productivity, long-term disability, family and social impact) (McClain-Nhlapo, 2024). The GRSF’s Road Crash Cost Analysis Tool (2026) assists in understanding the economic cost of road crashes for both high-income and low- and middle-income countries around the world. Drawing from a base Value of Statistical Life (VSL) and referencing a country’s gross national income per capita, VSL values can range between USD 3 to 5 million for HICs and USD 20,000 to 1.1 million for LMICs. Adding full societal costs further increases these figures, and national aggregate costs for road trauma often in the tens of billions of dollars per annum.
A long applied approach to evaluating programs is a benefit-cost analysis (BCA) of safety infrastructure treatments, which compares the cost of an intervention with the monetised value of the crashes the treatments are predicted to prevent. High-quality BCAs draw on crash modification factors, reliable unit costs for casualty crashes, and realistic estimates of traffic volumes and growth. Presenting safety investment in these economic terms is important for making the case to decision-makers who must allocate resources across competing priorities.
6.4. Key Guidelines and Design Resources #
There are a great many resources available that provide more detailed discussion and information on road crash data, tools and methods for evaluating road infrastructure safety risk and economic return. Key international guidelines and tools for practitioners include:
- Austroads Guide to Road Design (Parts 1–7) and Guide to Road Safety (Parts 1–6) – comprehensive Safe System-aligned technical guidance for Australian and New Zealand practitioners.
- FHWA Highway Safety Manual – US safety performance functions and crash modification factors for evidence-based design decisions.
- Global Street Design Guide – international people-centred design principles, developed from 72 cities across 42 countries.
- iRAP – predictive risk assessment and star rating tool for networks in over 140 countries.
- NACTO Urban Street Design Guide – US-focused guidance on designing streets for people, including cycling and transit infrastructure.
- PIARC Road Safety Manual – comprehensive reference for applying Safe System principles in diverse contexts, particularly LMICs.
- World Bank Guide for Safe Speeds – managing traffic speeds in low- and middle-income country contexts.
7. Safety Across the Infrastructure Lifecycle #
Road safety considerations do not begin at the design stage and end at the opening of a new piece of road infrastructure. Roads and streets have a dynamic lifecycle, commencing from strategic planning through to design, construction, operation, and the eventual renewal often many years later; existing roads may fall somewhere along these lifecycle stages, but regardless, safety must be actively managed at each and every stage. As illustrated below, different tools and approaches are appropriate at different points in the lifecycle, and decisions made early may shape or constrain the options available later.
It is perhaps at the planning stage that the most consequential safety decisions can be made – where a road goes, how it connects to the surrounding network, what speed environment will apply, what traffic will it carry, and what mix of users it will serve. Poor decisions at this stage will be expensive to correct and often may not be corrected at all (Global Designing Cities Initiative, 2016).
At the design stage, road safety audits provide independent review of how well design decisions align with Safe System principles. Early-stage audits, those at concept and preliminary design, are the most cost-effective since they can identify issues when they are cheapest to resolve – on paper. Post-opening audits identify issues that only become apparent once the road is in use; rectifying embedded safety issues at this stage will be more difficult and costly, but still necessary to avoid crashes developing over time.
During construction, quality assurance processes must ensure that the design intent is faithfully delivered, or if changes required then safety is not compromised. Construction defects such as improper barrier installation, inadequate drainage, substandard pavement, etc., will have safety consequences that may not become apparent until the road deteriorates and crashes occur.
In operation, speed management, regular scheduled maintenance, monitoring, and incident response all sustain the safety performance of the asset. In many jurisdictions, operational safety management receives less funding and attention than capital construction. This represents a systematic bias that undermines the long-term safety performance of the network.
At renewal and upgrade, the full lifecycle returns to the planning stage. Network renewal offers an opportunity to correct the errors of earlier design generations, to remove hazardous roadside features, upgrade intersections, add separation for vulnerable road users, and reset speed environments to reflect more modern road transport use and demands, but only if safety is treated as an embedded primary objective of the renewal process (WHO, 2017).
8. Future Directions #
Road safety infrastructure practice continues to evolve. While traditional approaches to road infrastructure management remain entrenched in many jurisdictions, several developments are reshaping how road professionals approach the design and management of safer roads and streets. This includes and broadening of technical disciplines involved in shaping the look, feel and overall form of roads and streets in towns, villages and cities and connecting urban centres with rural and regional communities.
The growing availability of data, from connected vehicles, GPS devices, video analytics, and third-party providers such as Google, TomTom, HERE, and CompassIoT, is enabling more precise, real-time understanding of how roads and streets are used and where risk is concentrated. This is expanding the reach of predictive risk assessment to networks and countries that previously lacked the resources and crash data needed to justify targeted investment.
Automated and connected vehicles present both opportunities and challenges for infrastructure managers. Vehicles capable of reading road markings, communicating with traffic signals, and maintaining safe following distances may reduce some categories of crash risk, but only if the infrastructure is sufficiently consistent and well-maintained to support automated systems reliably. Ultimately, a fully autonomous vehicle fleet may see the effective elimination of fatal and serious road trauma, however, ongoing investment in road infrastructure will be needed to support the transition, since the human-driven vehicle fleet will coexist with automated vehicles for many decades to come.
The global commitment to the Sustainable Development Goals (SDG), and in particular SDG 3.6, which calls for halving road deaths by 2030, continues to focus international attention and funding on road safety, particularly in LMICs (WHO, 2023a). Infrastructure investment programmes supported by the World Bank, regional development banks, and bilateral donors are increasingly requiring Safe System-aligned design as a condition of funding. There are similar requirements applied to road safety funding programs in high-income countries, although the degree of commitment is less uniform, since road safety focused funding make a relatively smaller proportion of capital and maintenance infrastructure funding. Funding criteria to shape road safety approaches to the management of road infrastructure will make a difference to road trauma, but upgrading road infrastructure will require time and committed funding; embedding road safety, developing a truly Safe System Approach to roads and streets requires as much an investment in how road professional practitioners plan, design, and manage road infrastructure as it does in the infrastructure improvements themselves.
The fundamental ambition of the Safe System Approach remains that road deaths and serious injuries are not an acceptable cost of mobility. Achieving the Vision Zero goal of no deaths or serious injuries on the world’s road networks requires sustained commitment to evidence-based infrastructure investment, progressive upgrading of existing networks, and embedding of Safe System principles in the next generation of professional practitioners.
9. Summary #
Roads and streets shape the safety of every journey. The decisions made in planning, designing, operating, and maintaining road infrastructure determine whether crashes occur, and whether they are survivable when they do. The Safe System Approach, grounded in the biomechanical limits of the human body and a commitment to designing out fatal and serious injury outcomes, provides the framework within which contemporary infrastructure practice should operate.
For early-career practitioners, the most important insight is that road trauma is not inevitable. It results from a system that can be changed and that infrastructure is one of the most powerful levers for change available. For experienced practitioners, the challenge is to translate Safe System principles into the day-to-day decisions of planning, design, and operations, and to build the evidence base that demonstrates the value of safety investment to decision-makers.
The tools, guidelines, and frameworks referenced in this chapter provide a rich evidence base for practice. The journey towards safer roads and streets requires commitment at every level, from network planning to pavement maintenance, and a sustained focus on the communities, and the individuals, whose lives depend on getting it right.
While not replacing economic value as a metric, FSI reduction value of countermeasures and programs is another metric for demonstrating value of safety investment options.
Reference List #
Australasian College of Road Safety. (2023a). ACRS policy position statement: A new systems thinking approach to road safety. https://acrs.org.au/wp-content/uploads/A-new-systems-thinking-approach-to-road-safety-FINAL.pdf
Australasian College of Road Safety. (2023b). ACRS policy position statement: Data and information needs. https://acrs.org.au/wp-content/uploads/ACRS-Data-Needs-PPS-2023.pdf
Australasian College of Road Safety. (2024). ACRS policy position statement: Motorcycle safety. https://acrs.org.au/wp-content/uploads/ACRS-Policy-Position-Statement_Motorcycle-Safety.pdf
Australasian College of Road Safety. (2026). ACRS policy position statement: Pedestrian safety. https://acrs.org.au/wp-content/uploads/ACRS-Policy-Position-Statement_Pedestrian-Safety.pdf
Austroads. (2020). Guide to traffic management part 1: Introduction to the guide to traffic management (Report No. AGTM01-20). https://austroads.gov.au/publications/traffic-management/agtm01
Austroads. (2021a). Guide to road safety part 1: Introduction and The Safe System (Report No. AGRS01-21). https://austroads.gov.au/publications/road-safety/agrs01
Austroads. (2021b). Guide to road safety part 3: Safe speeds (Report No. AGRS03-26) (1st edition). Austroads. https://austroads.gov.au/publications/road-safety/agrs03
Austroads. (2022). Guide to road safety part 6: Road safety audit (Report No. AGRS06-22). https://austroads.gov.au/publications/road-safety/agrs06
Austroads. (2025). Keeping people safe when walking – stream 1: Literature review (Report No. AP-R728-25). https://austroads.gov.au/publications/road-safety/ap-r728-25
Austroads. (n.d.). Guide to road design. https://austroads.gov.au/safety-and-design/road-design/guide-to-road-design
Boufous, S., Hatfield, J., & Grzebieta, R. (2018). The impact of environmental factors on cycling speed on shared paths. Accident Analysis & Prevention, 110, 171-176.
Brown, V., Peel, O., & Jackson, E. (2025). Austroads’ review of movement and place guidance (Report No. AP-R739-25). Austroads. https://austroads.gov.au/publications/network/ap-r739-25
Corben, B. (2020). Integrating Safe System with movement and place for vulnerable road users (Report No. AP-R611-20). Austroads. https://austroads.gov.au/publications/road-safety/ap-r611-20
De Rome, L., Boufous, S., Georgeson, T., Senserrick, T., Richardson, D., & Ivers, R. (2014). Bicycle crashes in different riding environments in the Australian Capital Territory. Traffic Injury Prevention, 15(1), 81-88.
European Climate Infrastructure and Environment Executive Agency. (2022). EU road safety: Towards Vision Zero. https://cinea.ec.europa.eu/publications/digital-publications/eu-road-safety-towards-vision-zero_en
Federal Highway Administration. (2025). Crash Modification Factors Clearinghouse. US Department of Transportation. https://cmfclearinghouse.fhwa.dot.gov/index.php
Federal Highway Administration. (2026). Highway Safety Manual. US Department of Transportation. https://highways.dot.gov/safety/data-analysis-tools/highway-safety-manual
Global Designing Cities Initiative. (2016). Global street design guide. https://globaldesigningcities.org/publication/global-street-design-guide/
Global Road Safety Facility. (2022a). Guide for road safety interventions: Evidence of what works and what does not work. World Bank. https://www.globalroadsafetyfacility.org/publications/guide-road-safety-interventions-evidence-what-works-and-what-does-not-work
Global Road Safety Facility. (2022b). Guide for safe speeds: Managing traffic speeds to save lives and improve livability. World Bank. https://www.globalroadsafetyfacility.org/publications/guide-safe-speeds-managing-traffic-speeds-save-lives-and-improve-livability
Global Road Safety Partnership. (2023). Speed management: A road safety manual for decision-making and practitioners. World Bank. https://www.grsproadsafety.org/wp-content/uploads/2023/05/Speed_management_English.pdf
Global Road Safety Partnership. (2026). Road crash cost analysis tool. World Bank. https://www.globalroadsafetyfacility.org/road-crash-cost-analysis-tool
Harrison, J. E., Watson, A., & Flavel, J. (2023). A national approach to measuring non-fatal crash outcomes stage 2: An Australian approach (Report No. AP-R694-23). Austroads. https://austroads.gov.au/publications/road-safety/ap-r694-23
Hopwood, C., Little, K., & Gaines, D. (2024). Safe System roadway design hierarchy: Engineering and infrastructure-related countermeasures to effectively reduce roadway fatalities and serious injuries (Report No. FHWA-SA-SS-069). Federal Highway Administration. https://highways.dot.gov/sites/fhwa.dot.gov/files/2024-01/Safe_System_Roadway_Design_Hierarchy.pdf
International Road Assessment Programme. (2022a). Road Safety Toolkit: Forgiving roads concept. https://toolkit.irap.org/safer-road-treatments/forgiving-roads-concept/
International Road Assessment Programme. (2022b). Road Safety Toolkit: Self-Explaining Road (SER) concept. https://toolkit.irap.org/safer-road-treatments/self-explaining-road-ser-concept/
International Road Assessment Programme. (2026). iRAP. https://irap.org/
International Traffic Safety Data and Analysis Group. (2011). Reporting on serious road traffic casualties. International Transport Forum/OECD.
International Transport Forum/OECD. (2026). Road Safety in Action: The Safe System Tool. International Transport Forum/OECD. https://safesystemtool.itf-oecd.org/en/
Job, R. F. S., & Wambulwa, W. M. (2020). Features of low-income and middle-income countries making road safety more challenging. Journal of Road Safety, 31, 79-84.
Jurewicz, C., Sobhani, A., Woolley, J., Dutschke, J., & Corben, B. (2016). Exploration of vehicle impact speed – Injury severity relationships for application in safer road design. Transportation Research Procedia, 14, 4247-4256. https://doi.org/10.1016/j.trpro.2016.05.396
McClain-Nhlapo, C., Raja, D.S., Groce, N., Mont, D., Pinilla-Roncancio, M., Hanass-Hancock, J., & Chatukuta, M. (2024). Disability and road traffic accidents: Assessing the costs and consequences of rehabilitation and living with a disability following a road traffic injury (193554). World Bank. https://documents.worldbank.org/en/publication/documents-reports/documentdetail/099091324114514561
Milling, D., Affum, J., Chong, L., & Taylor, S. (2016). Infrastructure improvements to reduce motorcycle casualties (Report No. AP-R515-16). Austroads. https://austroads.gov.au/publications/road-safety/ap-r515-16
Mitra, S., Turner, B., Mbugua, L. W., Neki, K., Barrell, J., Wambulwa, W., et al. (2021). Guide to integrating safety into road design. World Bank. https://www.globalroadsafetyfacility.org/publications/guide-integrating-safety-road-design
NACTO. (2026). Urban street design guide: A blueprint for designing 21st century streets. https://nacto.org/publication/urban-street-design-guide/
National Transport Commission. (2025). Automated vehicle safety reforms: Consultation report. https://www.ntc.gov.au/sites/default/files/assets/files/Automated%20vehicle%20safety%20reforms%20-%20consultation%20report.pdf
New Zealand Transport Agency Waka Kotahi. (2022). Speed management guide: Road to Zero edition. https://www.nzta.govt.nz/assets/resources/speed-management-guide-road-to-zero-edition/speed-management-guide-road-to-zero-edition.pdf
New Zealand Transport Agency Waka Kotahi. (2025). Crash estimation compendium. New Zealand crash risk factors guideline. https://www.nzta.govt.nz/assets/resources/monetised-benefits-and-costs-manual/crash-risk-factors-guidelines-compendium-2025.pdf
New Zealand Transport Agency Waka Kotahi. (2025). One Network Framework factsheet. https://nzta.govt.nz/assets/Roads-and-Rail/onf/docs/onf-factsheet-2025.pdf
New Zealand Transport Agency Waka Kotahi. (2026). Aotearoa urban street planning and design guide. https://www.nzta.govt.nz/partners/maintenance-and-operations/highways-information-portal/technical-disciplines/urban-design-and-landscape/aotearoa-urban-street-guide
Peden, M., Oyegbite, K., Ozanne-Smith, J., Hyder, A. A., Branche, C., Rahman, A. F., et al. (2008). World report on child injury prevention. World Health Organization & UNICEF. https://www.who.int/publications/i/item/9789241563574
PIARC. (n.d.). Road safety manual: A manual for practitioners and decision makers on implementing safe system infrastructure. https://roadsafety.piarc.org/en/introduction
Stearns, J. A., Avedzi, H. M., Yim, D., Spence, J. C., Labbaf, F., Lamboglia, C. G., et al. (2023). An umbrella review of the best and most up-to-date evidence on the built environment and physical activity in older adults ≥60 years. Public Health Reviews, 44, 1605474.
Theeuwes, J., & Godthelp, H. (1995). Self-explaining roads. Safety Science, 19(2), 217-225. https://www.sciencedirect.com/science/article/abs/pii/092575359400022U
Theeuwes, J., Snell, J., Koning, T., & Bucker, B. (2024). Self-explaining roads: Effects of road design on speed choice. Transportation Research Part F: Traffic Psychology and Behaviour, 102, 335-361.
Turner, B. M., Eichinger-Vill, E. M., El-Samara, S., Adriazola-Steil, C., & Burlacu, F. A. (2024). Guide for safe speeds: Managing traffic speeds to save lives and improve livability. World Bank & World Resources Institute. https://documents.worldbank.org/en/publication/documents-reports/documentdetail/099032224020526401
United Nations Children’s Fund. (2022). Technical guidance for child and adolescent road safety. https://www.unicef.org/documents/unicef-technical-guidance-child-and-adolescent-road-safety
United Nations General Assembly. (2023). Strengthening the links between all modes of transport to achieve the Sustainable Development Goals (Resolution A/RES/78/148). https://digitallibrary.un.org/record/4031790
Wambulwa, W. M., Job, R. F. S. & Turner, B. M. (2019). Guide for road safety opportunities and challenges: Low- and middle-income countries country profiles (Report No. 145961). World Bank. https://documents.worldbank.org/en/publication/documents-reports/documentdetail/447031581489115544
Williamson, A. (2021). Why do we make safe behaviour so hard for drivers. Journal of Road Safety, 32, 24-36.
Woolley, J., Stokes, C., Turner, B., & Jurewicz, C. (2018). Towards Safe System infrastructure: A compendium of current knowledge (Report No. AP-R560-18). Austroads. https://austroads.gov.au/publications/road-safety/ap-r560-18
World Health Organization. (2017). Save lives: A road safety technical package. https://www.who.int/publications/i/item/save-lives-a-road-safety-technical-package
World Health Organization. (2020). Cyclist safety: An information resource for decision makers and practitioners. https://www.who.int/publications/i/item/cyclist-safety-an-information-resource-for-decision-makers-and-practitioners
World Health Organization. (2022). Powered two- and three-wheeler safety: a road safety manual for decision-makers and practitioners. https://www.who.int/publications/i/item/9789240060562
World Health Organization. (2023a). Global status report on road safety 2023. https://www.who.int/teams/social-determinants-of-health/safety-and-mobility/global-status-report-on-road-safety-2023
World Health Organization. (2023b). Pedestrian safety: A road safety manual for decision-makers and practitioners. https://www.who.int/publications/i/item/pedestrian-safety-a-road-safety-manual-for-decision-makers-and-practitioners
Wramborg, P. (2005, October 5-7). A new approach to a safe and sustainable road structure and street design for urban areas [Presentation]. Road Safety on Four Continents, Warsaw, Poland. Swedish National Road and Transport Research Institute (VTI), Linkoeping, Sweden.
